40+ Facebook Statistics Marketers to Know in 2025
98% accurate, real-time transcription in just a few clicks. 58 languages and multiple platforms supported.
Facebook’s popularity might seem to be declining among Gen Z, but it remains the most used social media platform globally. Having used Facebook extensively in my marketing efforts for more than 12 years, I’ve realized the importance of keeping up with the platform's trends, audiences' demands, and more. I want you to have the same benefit so you can level up your Facebook marketing efforts, so I’ve listed 40+ Facebook statistics you must know as a marketer in 2025.
Facebook stats (top picks)
As of 31 December 2023, Facebook had 3.07 billion monthly active users (MAU), a 3% year-over-year increase.
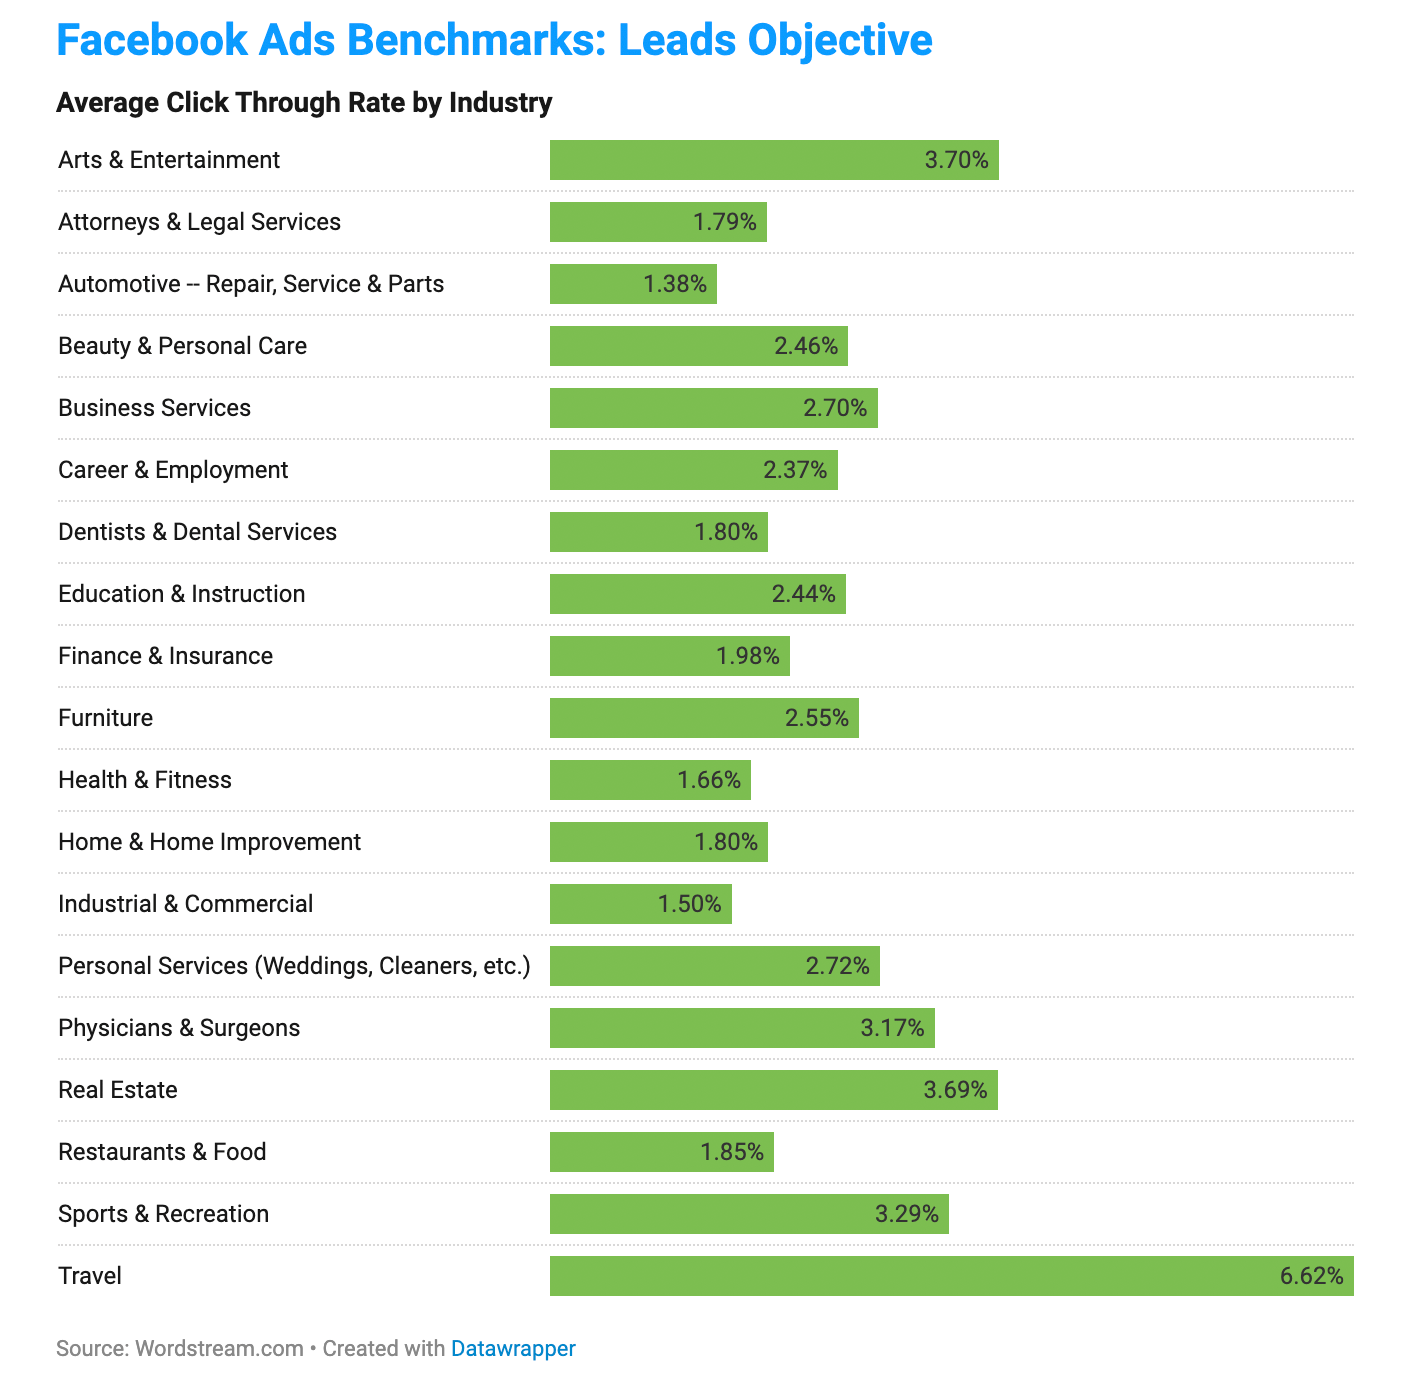
Travel has the highest CTR at 6.62% in lead generation campaigns, followed by the arts and entertainment sector at 3.70% and real estate at 3.69%.
Egypt spends the most time on the Facebook mobile app, at 33 hours and 22 minutes per month.
63.5 million people have made at least one purchase via Facebook.
50% of people have visited a website where they can purchase a product or service after seeing it on a Facebook story.
Overview of Facebook’s reach and popularity
The first set of statistics I list highlights Facebook’s reach and popularity in terms of its user base and the number of active users. Remember that these don’t include other platforms in Meta’s suite, such as Facebook Messenger, WhatsApp, and Instagram.
How many people use Facebook in 2025?
How big is Facebook’s user base, and how is it distributed across the global market? Here are a few key Facebook user statistics that highlight Facebook’s growth.
As of 31 December 2023, Facebook had 3.98 billion Monthly Active People (MAP), a 6% increase year over year.
As of December 2023, Facebook’s data presents a total of 3.19 billion Daily Active People (DAP).
Sources: Meta
Is Facebook still popular among key demographics?
Which demographic has Facebook’s popularity increased in, and where is it the most and least popular? Here are a few key numbers about Facebook demographics to keep in mind.
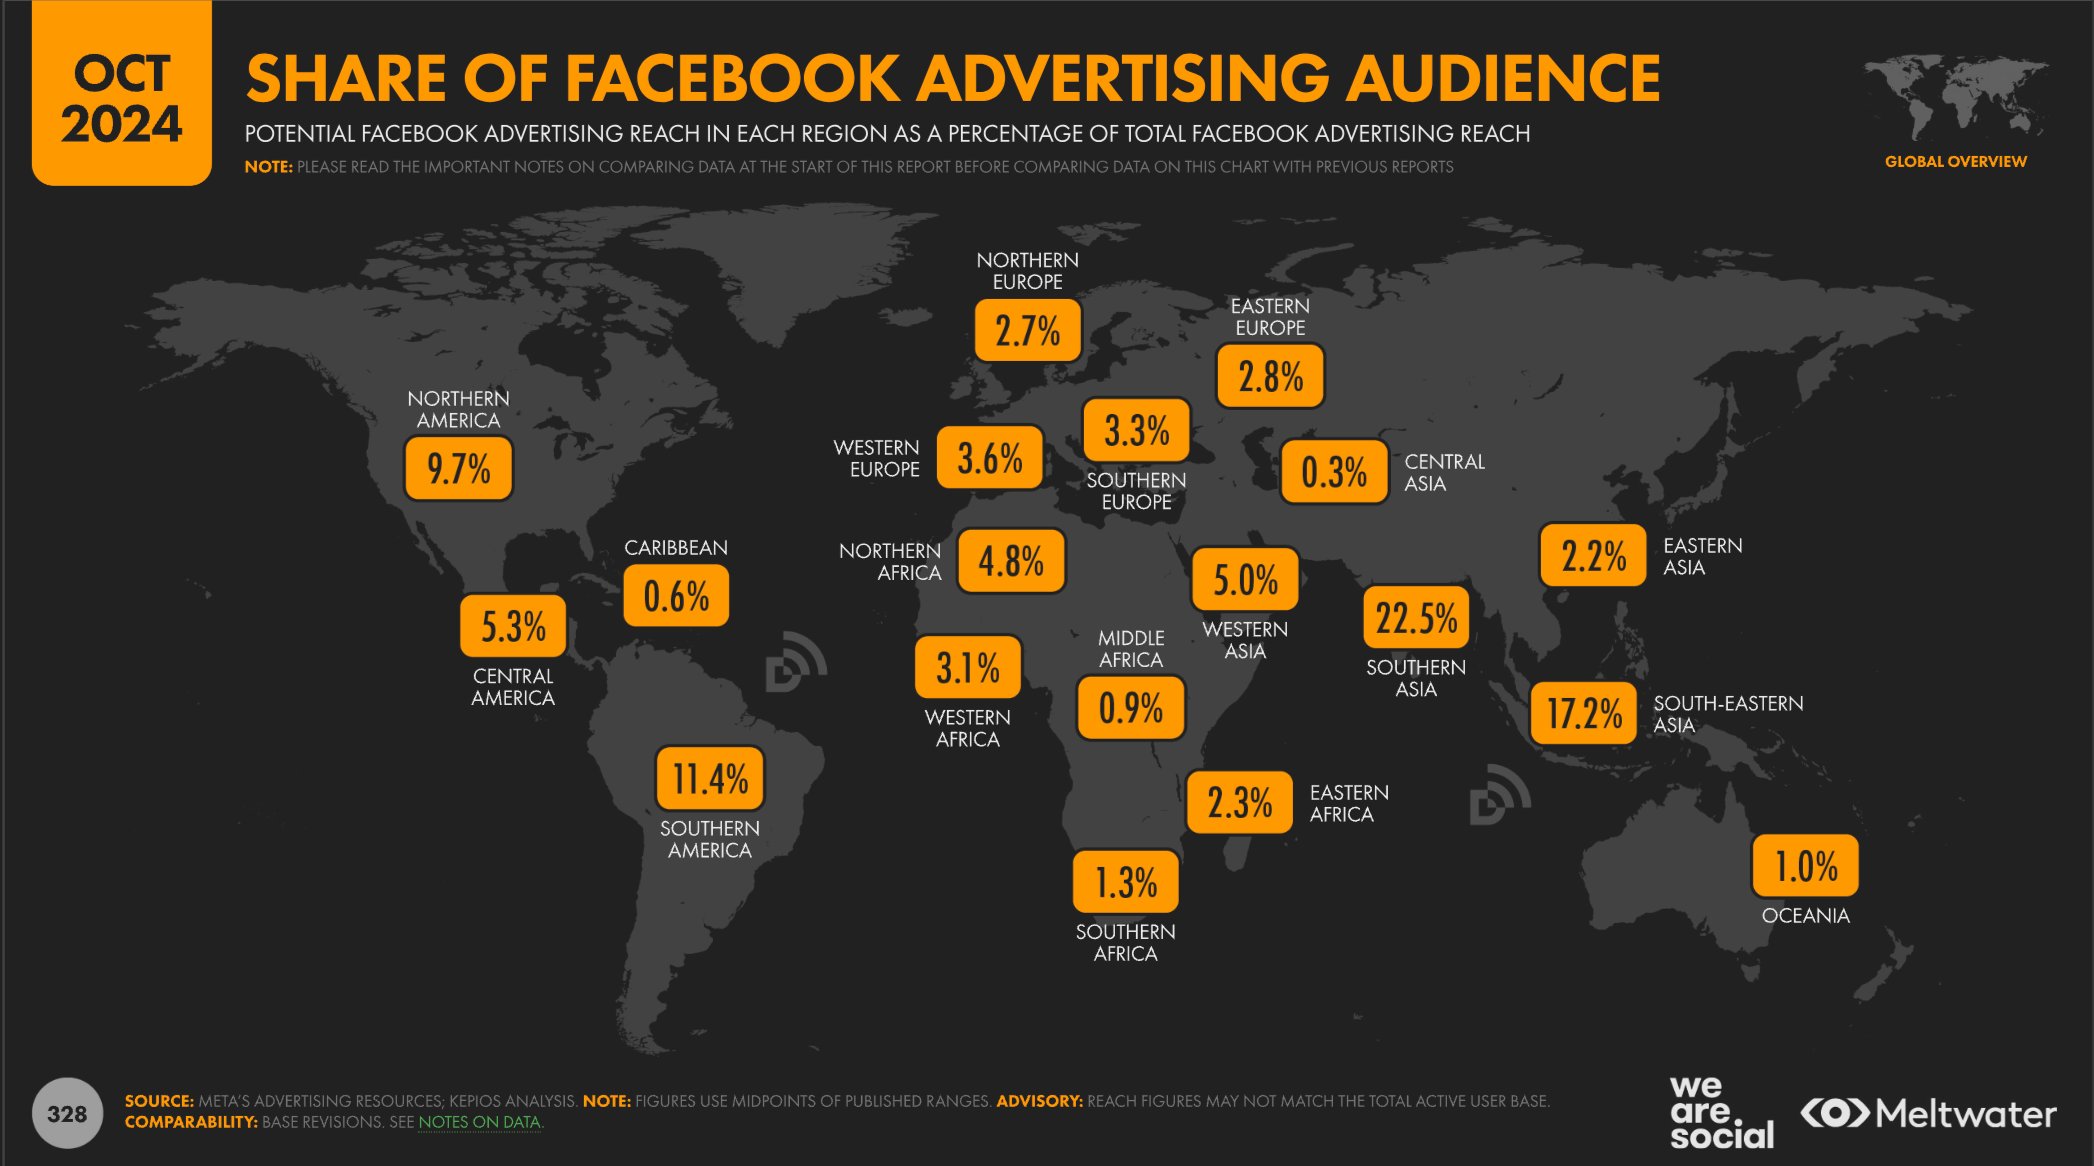
The biggest share of Facebook’s advertising audience lies in Southern Asia at 22.5%.
This is followed by Southeastern Asia at 17.2%. Southern America comes in third place at 11.4%.
The smallest audience lies in Central Asia at 0.3%, followed by the Caribbean at 0.6%.
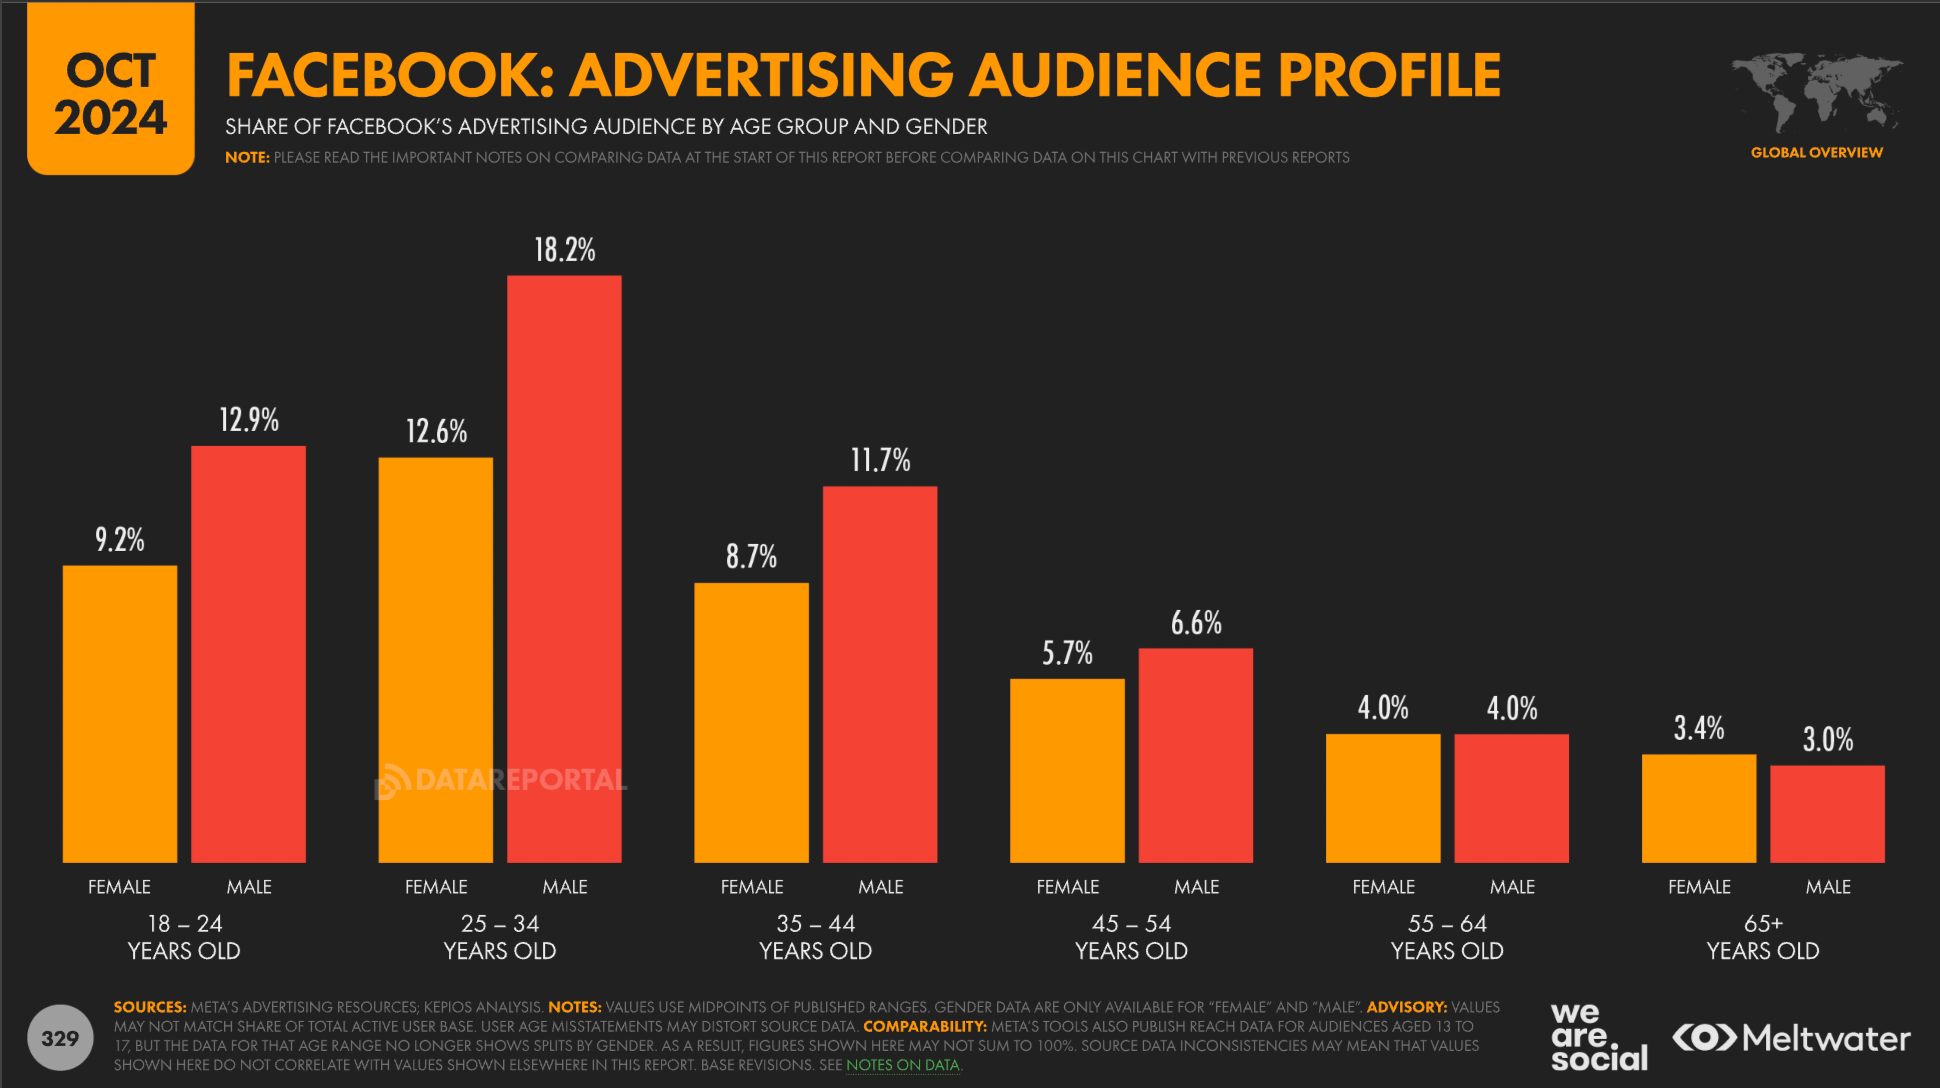
Facebook is most popular among the ages of 25 and 34, with a 12.6% female advertising audience and 18.2% males.
 Sources: Data Reportal
Facebook engagement statistics
Knowing how many people use Facebook and how much time they spend on its mobile app every day is crucial for marketers.
Facebook monthly active users and daily active users
According to Meta’s Earnings Report for Q4 of 2023, Facebook had 3.07 billion monthly active users (MAU) as of 31 December 2023, a 3% increase year over year.
As of December 2023, Facebook had 2.11 billion daily active users (DAU), a 6% increase year over year.
Sources: Meta
Time spent on Facebook and usage frequency
Egypt has the highest monthly time spent on Facebook’s mobile app at 33 hours and 22 minutes.
The average time spent per month in the US is 16 hours and 27 minutes, while the worldwide average is 18 hours and 44 minutes.
Sources: Data Reportal
Facebook advertising and marketing statistics
How much potential does Facebook offer from an advertising and marketing perspective? I break down all the irrelevant advertising numbers and Facebook marketing statistics numbers in the three sections below.
Facebook advertising statistics and trends
The adult reach rate (18+ years) for Facebook ads is the highest in the Philippines at 113%. This is followed by the UAE at 101.1%.
The ad reach rate for the USA is 70.8%, and the worldwide average stands at 38.6%.
In terms of the largest advertising audience, India takes the top spot with a total reach of 373,150,000, followed by the USA with a reach of 192,700,000.
Facebook ads get an average CTR of 2.50% across all industries. This is specific to lead generation ads.
Facebook’s ad reach increased from 2.08 billion in October 2022 to 2.22 billion in October 2024, but the highest ad reach within this period was 2.31 billion in October 2023.
Sources: Data Reportal, WordStream
Facebook’s share of the global ad market
Facebook has a total advertising reach of 2.22 billion people, second only to YouTube, which has a total reach of 2.53 billion. TikTok and Instagram share a total reach of roughly 1.69 billion.
Regarding the number of people spending time researching brands and products, Facebook comes in second place at 52.8%. Once again, YouTube takes the top spot at 62.3%.
Sources: Data Reportal
Effectiveness of Facebook ads by industry
Which industries benefit the most from Facebook ads? Which formats work best? You must know these key pieces of information, and the statistics below will help.
In terms of lead generation campaigns, travel has the highest CTR at 6.62%, followed by the arts and entertainment sector at 3.70% and real estate at 3.69%.
Automotive (repairs and spare parts) and industrial and commercial have the lowest CTRs, at 1.38% and 1.50%, respectively.
 Sources: WordStream
Key Facebook content trends and user behavior
Understanding what Facebook is most used for, which formats work best, and which receive the most engagement is crucial for marketers to optimize their campaigns.
Types of content that perform best
Which formats work best and offer the highest potential ROI on Facebook? Here are a few answers that will help.
When compared as a percentage of post reach, the format with the highest engagement is ‘status’ posts at 10.50%. Reels come in second place with an engagement rate of 8.65%, followed by link posts at 6.20%.
The median number of posts posted by Facebook pages across all industries is 4.69 per week.
Facebook Reels account for the format with the highest engagement, at 0.35%, compared to a page's followers.
Facebook videos come in second place at 0.33%, and photo posts receive an engagement rate of 0.25%. This shows that audiovisual content has a much greater appeal and can also keep audiences engaged for longer durations.
Sources: Data Reportal, RivalIQ
Facebook Live and video consumption trends
What is the impact of the rise of video content on Facebook? How do these formats affect user engagement? Here are a few numbers to keep in mind.
50% of the time spent on Facebook is watching videos.
Vertical videos with audio, also known as Facebook Reels, see a 35% higher CTR than other types of video content on the platform. Combine this data with trends on what kind of content your audience likes to see, and you stand a good chance of generating a higher ROI.
Facebook is the second most popular platform in the USA, after YouTube, for live-streaming.
Sources: Facebook, Facebook, Statista
Engagement rates by post type and time of day
What kind of posts receive the highest engagement on Facebook, and how does the time of the day affect engagement? Here’s what you need to know to plan your content effectively.
Engagement on Facebook Reels stands at 8.65% of the total reach, whereas photo posts have an engagement of 4.25%. Audiovisual content is thus much more effective at retaining the audience's attention and keeping them engaged for longer durations.
The best time to post on Facebook:
The five best hours to post on Facebook are 7 AM, 8 AM, 9 AM, 10 AM, and 11 AM.
The worst five hours to post are 12 AM, 2 AM, 3 AM, 4 AM, and 5 AM.
The three best days to post on Facebook are Mondays, Wednesdays, and Fridays.
The three worst days to post on Facebook are Thursdays, Saturdays, and Sundays.
Sources: Data Reportal, CoSchedule
Use Notta's AI transcription tool to quickly and easily transcribe audio and videos. We guarantee accuracy and ease of use.
Facebook demographics and audience insights
What do Facebook demographics tell you about its marketing and advertising potential? Aspects like the audience’s geographic distribution also play a key role, and the next two sections offer some helpful insights.
Age and gender distribution
9.2% of Facebook’s advertising audience is female between the ages of 18 and 24, while 21.9% is female.
As stated earlier, 12.6% of those between the ages of 25 and 34 are female, while 18.2% are male.
Between the ages of 35 and 44, the usage starts to fall, with females accounting for 8.7% and males accounting for 11.7%.
Facebook usage among teens has considerably dropped, with only 33% using It in 2023.
 Sources: Data Reportal, Pew Research Center
Geographic distribution of users
Among countries with a growing user base, Egypt has the highest Facebook growth QoQ at +1.5%. Bangladesh and France follow with a +0.8% growth rate QoQ.
Among these three countries, Bangladesh has the highest total reach, at 55,500,000, while Egypt has a reach of 46,600,000, and France has a reach of 32,750,000.
Sources: Data Reportal
Facebook business tools and their popularity among marketers
Facebook offers a few key business tools. The two sections below elaborate on their benefits and popularity among marketers.
Usage of Facebook Pages, Groups, and Shops
Facebook is the leading platform for social commerce, with 63.5 million people making at least one purchase via Facebook. This figure includes sales on Facebook Marketplace and Shops.
19% of US consumers also start their shopping search on Facebook.
Up to 1 billion online shoppers buy something from Facebook Marketplace each month.
Besides Facebook Marketplace, businesses also use pages, groups, and shops to reach out to their target audiences, where they are bound to get maximum visibility.
Sources: Capital One Shopping, eMarketer
Facebook Analytics and Insights usage
What was formerly known as Facebook Analytics is now the Meta Business Suite. It offers key data and metrics that marketers can use to understand their target audiences and the effectiveness of their content.
Some of the most important analytics that you should consider include:
Facebook Page overview analytics
Facebook Page reach
Facebook Page engagement
Facebook audience insights
Post insights
Facebook Insights works with the analytics features to provide insights on audience, demographics, age, content insights, and more.
Facebook statistics for business and e-commerce
Facebook plays a key role in driving e-commerce via ads and understating the trends in purchasing patterns. The effectiveness of ads is crucial for marketers and advertisers alike.
Role of Facebook in driving e-commerce
Facebook and Instagram generated roughly $94 million in social commerce revenue in 2024.
Additionally, over 64 million customers are estimated to shop on Facebook.
58% of people have browsed through a brand’s website after seeing a product on Facebook Stories. An additional 31% have visited a shop to look at a product in person.
Sources: Statista, eMarketer, Facebook
Success rate of Facebook ads in lead generation
The average cost per mile (CPM) on Facebook is $11.
50% of people have visited a site where they can buy a product or a service after seeing it advertised on a Facebook Story.
Fitness advertisers have averaged a conversion rate of 14.29% from Facebook ads. This is followed by education at 13.58% and employment and job training at 11.73%.
Aldar Properties, a Middle East property developer, generated a 6x increase in appointment booking by integrating its CRM with Meta and optimizing lead gen ads for conversion leads.
Sources: WebFX, WordStream, Facebook, Facebook
Integration with other platforms and CRMs
The Meta Business Suite offers you the ability to connect to any CRM you use so you can directly retrieve all your leads from your ad campaigns. This offers several benefits, including:
Directly importing your leads into your CRM instead of downloading and organizing them on a spreadsheet.
Quicker response and action times to ensure you can convert leads to paying customers.
Organizing customer information and gathering insights that can help marketers improve their future campaigns and customer targeting.
Reducing the cost of handling data manually which results in a more efficient allocation of resources.
Sources: Facebook
The bottom line
Keeping yourself updated with changes in Facebook’s user base, customer behavior, and demographics is key to optimizing your ad and marketing campaigns for a higher ROI. I’ve listed over 40 key Facebook statistics and insights to help you achieve higher returns from your campaigns. When your marketing team meets to discuss your Facebook campaigns, gather user feedback, or conduct meetings, you can use a tool like Notta to accurately transcribe every interaction.