50+ Netflix Statistics for 2025: Revenue, Usage & Growth
98% accurate, real-time transcription in just a few clicks. 58 languages and multiple platforms supported.
In 1997, Netflix launched a service that shipped DVDs to customers by mail. Ten years later, Netflix launched a product that allows anyone to stream movies over the Internet. Today, Netflix has grown into one of the most used streaming services in the world, with Amazon Prime Video being the top competitor. I have spent weeks finding information about Netflix's revenue, user growth, and more. Keep reading to find the latest 50+ Netflix statistics for 2025.
Netflix stats (top picks)
Netflix had over 282 million paid subscribers in the third quarter of 2024, which indicates a five-million-member increase from previous quarters.
The highest number of Netflix users comes from the United States, followed by Brazil.
Netflix has a conversion rate of 93%, which is higher than that of Amazon Prime.
In 2024, users spent around one hour and four minutes daily on Netflix.
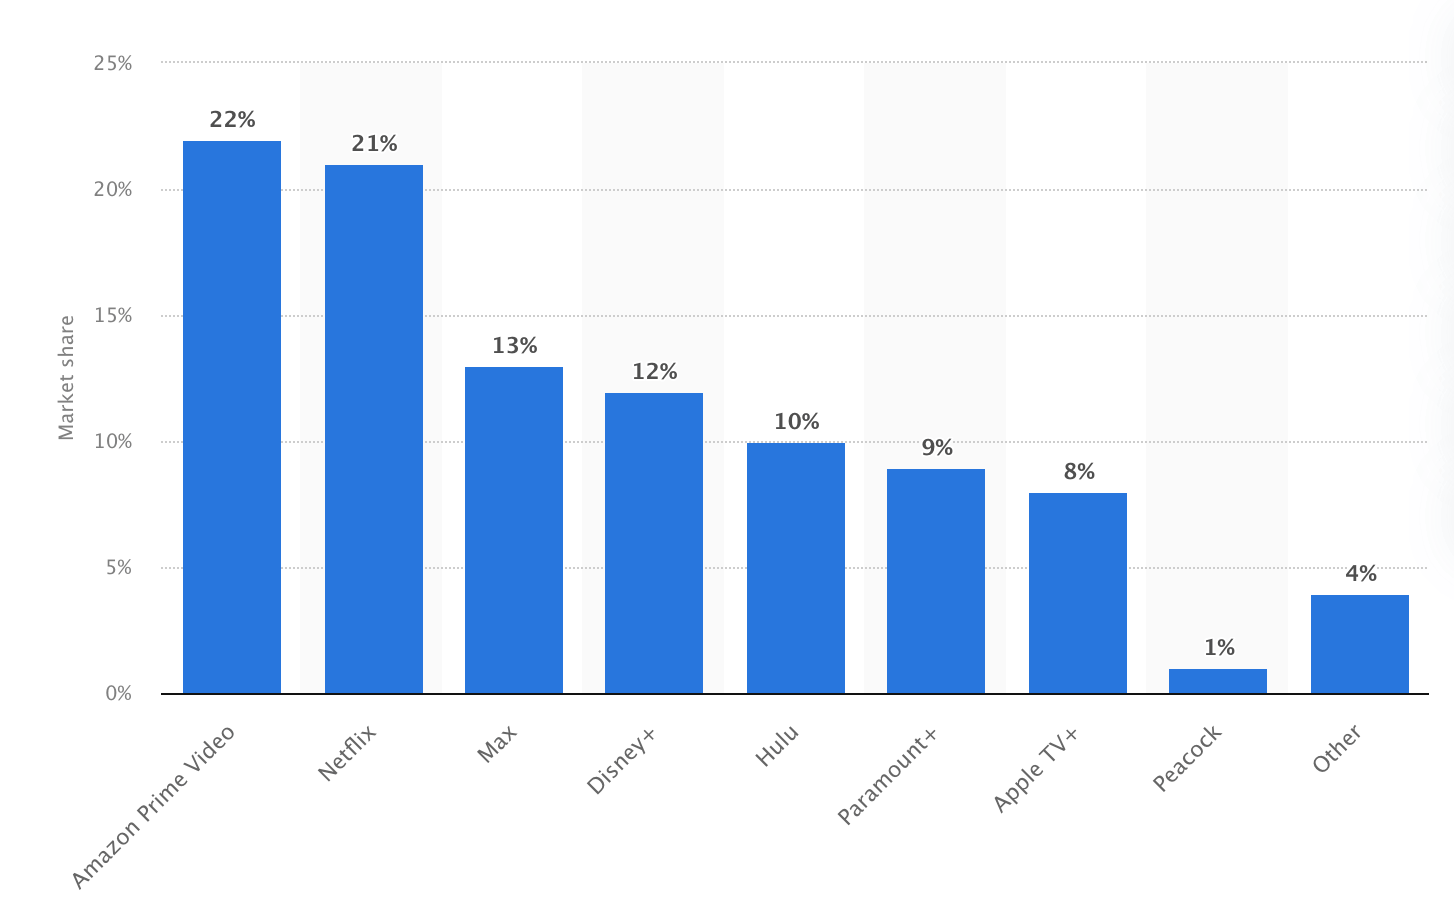
Netflix's market share is 21%, which makes it the second most popular SVOD platform in the US in terms of market share.
Netflix revenue and growth statistics
Netflix's annual revenue has consistently increased over the years. Netflix generates revenue mainly from subscription fees, original content production, and content licensing. Streaming services are primarily available in three tiers: Premium, Standard, and Standard with Ads, which adds to the total Netflix profit.
Sources: Statista
Global revenue breakdown
Netflix is one of the most popular video streaming platforms in the streaming space. Here are some of the Netflix revenue statistics that shed light on the global revenue generated in the past years:
Netflix's US subscription revenue will reach $14.52 billion by the end of 2024, an increase from $13.58 billion in 2023.
Netflix's annual revenue has consistently grown over the years and reached 33.7 billion US dollars in 2023.
The annual revenue of 2023 is around 10 times higher than Netflix's revenue of 3.4 billion US dollars in 2002.
In Q3 of 2024, Netflix generated nearly $9.8 billion in total revenue, up from about $8.5 billion in the corresponding quarter of 2023.
Subscription and ad revenue
Netflix reported strong earnings, with a 15% year-over-year increase to $9.82 billion. Here are some other Netflix statistics comparing the revenue generated by subscriptions vs. ads.
The global paid memberships grew to 282.72 million, which marks a 14.4% increase.
Netflix rolled out its ad-supported subscription plan in 2022 and amassed 15 million global monthly active users for the ad tier in just one year.
According to eMarketer, Netflix's ad revenue will grow 33.7% year over year to $5.28 in 2024.
Netflix subscriber statistics
The number of Netflix subscribers has significantly grown over the years. Here are some statistics revealing how many subscribers does Netflix have:
As of Q3 of 2024, Netflix had around 282.7 million paid subscribers, an increase of over five million from the previous quarters.
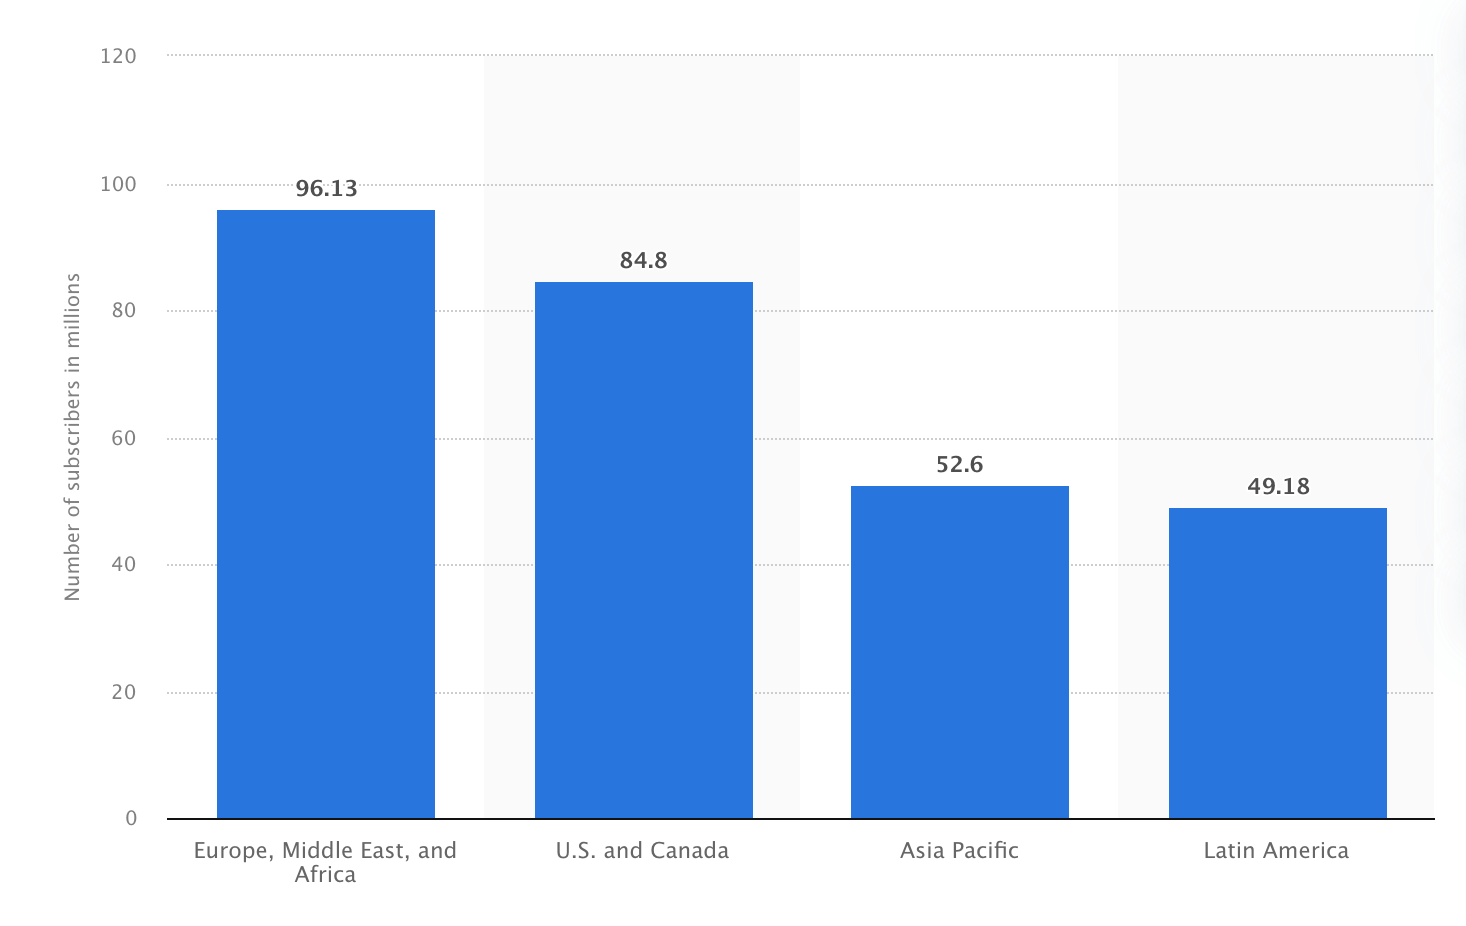
Most Netflix subscribers are based in Europe, Africa, and the Middle East, accounting for nearly 96 million of the global subscriber base.
Netflix added 9.33 million new subscribers in the first quarter of 2024, partly due to the password-sharing crackdown.
Subscriber by region
Netflix’s daily active users are increasing primarily due to the introduction of its ad-supported tier. This tier offers a cheaper subscription option, attracting new users who were previously hesitant due to price. The United States holds the largest share of Netflix users, followed by Brazil, the United Kingdom, and Germany.
As of 2024, the United States has the highest number of Netflix users and accounts, with over 66.7 million subscribers.
Brazil ranks second with 15.3 million subscribers, and the United Kingdom comes third with 14.1 million subscribers.
Germany and France hold fourth and fifth positions with around 13.2 million and 10.1 million Netflix subscribers.
Sources: Flixpatrol, Statista
Paid vs free trials
Netflix's conversion rate is 93%, which means that around 93% of users convert from free trials to paid subscriptions. This is higher than other streaming platforms like Amazon Prime, which has a conversion rate of 73%.
Netflix has discontinued free trials across most regions, including the US, meaning there is no free trial option to compare against a paid subscription. Hence, you can only access Netflix content by signing up for a paid plan, which you can cancel anytime if you decide not to continue.
User engagement statistics
Netflix uses sophisticated algorithms to analyze user data like viewing history, ratings, and search queries to suggest content highly relevant to individual users, making it easier to find something they want to watch. Netflix provides a sheer variety and number of things to watch, so the watch time and number of users are increasing yearly.
Watch time and content preferences
According to the August 2023 survey, US adults spent an average of 62 minutes per day on Netflix, an increase from 53.3 minutes per day in 2019.
Active users will spend an average of one hour and four minutes per day with Netflix in 2024.
As of October 2024, Wednesday is the most popular English-language Netflix TV show, with over 252 million views in just 91 days.
The fourth season of the American fiction of Stranger Things gathered around 141 million views in October 2024.
Sources: Statista, Statista, eMarketer
Device usage trends
In September 2023, the TV screen was the most used device to watch Netflix, with over 132 million unique viewers. The mobile device was the second most popular device, with over 78 million US people watching Netflix TV series, followed by computers.
Sources: Statista
Market share and competition
Netflix's popularity is booming around the world, and statistics suggest that the streaming platform will continue to be the market leader.
Comparison with key competitors
Netflix is the second most popular SVOD (subscription video on demand) platform in the US, with a market share of around 21%. Amazon Prime has surpassed Netflix in becoming the most popular SVOD platform, with a market share of 22%.
Here is a detailed breakdown of Netflix's market share compared to its competitors:
Amazon Prime Video: 22% market share
Netflix: 21% market share
Max: 13% market share
Disney+: 12% market share
Hulu: 10% market share
Paramount: 9% market share
Apple TV+: 8% market share
Peacock: 1% market share
Other: 4% market share
 Sources: Statista
Regional competition
Netflix faces fierce competition from other streaming platforms like Amazon Prime, HBO Max, Disney+, and Peacock. However, the innovative entertainment platform has become a dominant player in the online streaming space.
Netflix invests heavily in producing original content to attract new customers and retain existing ones. However, the cost of producing original content is increasing, which eventually puts pressure on Netflix's profit margins.
Sources: Kavout, Canva Business Model
Netflix original content statistics
In 2022, Original and exclusive content on Netflix accounts for over 50% of titles in the US catalog, an increase from the 20.6% share in March 2019.
Content production volume
According to Ampere's SVOD tracking data, more than 3700 original branded (original and exclusive) movies and TV seasons are in the Netflix US library. Here are some other Netflix statistics revealing how much content is produced:
Netflix increased its spending on original content by $6.2 billion in 2021, which is more than double the next highest spender, Disney+, which spent nearly $2.8 billion.
Under the current growing trends and content production volumes, 75% of Netflix movies and TV seasons will either be Original or Exclusive by the end of 2024.
Sources: Ampere Analysis, Vitrina
Content budget allocation
The content acquisition budget has undergone a remarkable transformation in the past years.
Netflix spent $2.4 billion on content in 2013. In 2020, it spent 62.2% on acquisitions and 37.8% on originals.
Netflix's content spending amounted to 13 billion US dollars in 2023 and will likely reach 17 billion US dollars by the end of 2024.
Netflix is projected to spend 53.5% on acquisitions and 46.5% on originals by the end of 2025, which signals that the streaming platform will shift toward original content.
Sources: Statista
Notta can convert your spoken interviews and conversations into text with 98.86% accuracy in minutes. Focus on conversations, not manual note-taking.
User demographics and preferences
Gen Z makes up the bulk of Netflix's subscriber base, with most of the people coming from Europe, the Middle East, and Africa.
Age and income demographics
As of March 2023, 72% of survey respondents are between 18 and 29 years old.
70% of Netflix users are between 30 and 49 years old, whereas 69% are between 50 and 64.
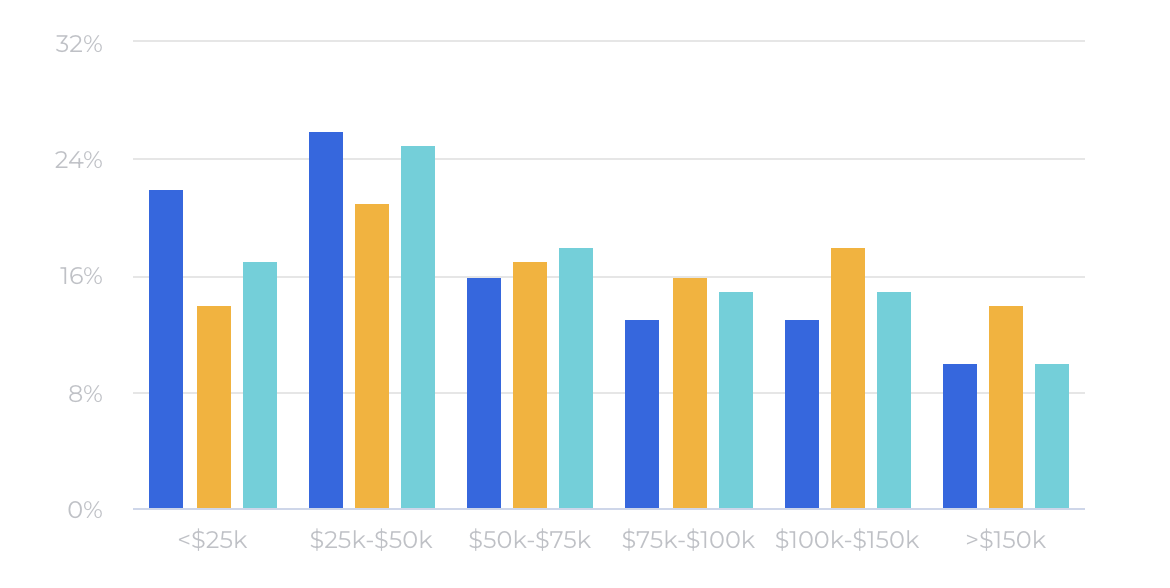
14% of Netflix users earn less than $25,000, whereas 21% of them earn between $25,000 and $50,000, indicating the platform's popularity.
Sources: WallStreetZen, Statista, Statista
Geographic distribution
96.13 million Netflix subscribers come from Europe, the Middle East, and Africa.
84.8 million subscribers are from the US and Canada, whereas 52.6 million are from Asia Pacific.
Only 49.18 million Netflix subscribers are from Latin America.
 Source: Statista
Trends and future projections
Netflix revealed that the video streaming platform is expected to deliver solid revenue and profit growth by improving core series and film offerings. The company also plans to invest in new growth initiatives like gaming and ads. With an audience of over 600 million, Netflix aims to add more tastes, languages, and cultures than any of its competitors.
Sources: Netflix
Expansion in emerging markets
Netflix is expecting to keep growing revenue at a double-digit percentage in 2025.
Netflix forecasts revenue of $43 - $44 billion in 2025, which is 11 - 13% higher than in 2024.
The video streaming platform expects revenue growth to be driven by increased paid memberships and average revenue per member.
Netflix targets a 28% operating margin in 2025 compared to 27% in 2024.
According to Statista, Netflix's subscription forecast for 2029 reveals growth across all regions. North America is expected to reach 93.5 million subscribers by 2029, followed by Asia Pacific, which is expected to reach 70.1 million.
Sources: Statista, Statista, Variety
Challenges in the competitive landscape
Canada and the United States have always been Netflix's most important markets because of the saturated SVOD industry and ever-increasing costs. However, Netflix has struggled to retain customers in this region and saw significant growth in Europe, the Middle East, and Africa in the second half of 2022. North American countries remain Netflix's most valuable markets by far, and in 2024, Netflix generated around $17.06 as an average monthly revenue per user.
Sources: Statista
The bottom line
As of 2024, Netflix has over 280 million subscribers, which is one of the highest numbers among streaming services. It's recognized as one of the leading streaming platforms and continues to draw a solid user base with its content. Whether you are a marketer looking to leverage the platform to market your service or a media analyst, these Netflix statistics will help you prepare for 2025 and beyond.
