80+ Social Media Statistics: Usage, Growth & Trends 2025
Record, transcribe and summarize conversations with one click.
Over the past couple of years, social media has become more than just a tool to connect with friends and family. It now sets the stage for entire marketing ecosystems that companies plan and budget for just as much as they do for their other channels.
If you’re looking to capitalize on social media or are simply curious about its usage trends, I’ve spent weeks finding some of the most important social media statistics you must know as we approach 2025.
Social media stats (top picks)
In 2023, 4.89 billion people worldwide used social media, and this number is expected to rise to almost 6 billion by 2027.
256 million new identities joined social media platforms between October 2023 and October 2024. This equates to more than 700,000 new users every single day.
As of April 2024, Northern and Western Europe had the highest social network penetration rates globally, reaching 80.2% and 78.2%, respectively.
The country with the highest social media adoption rate compared to the total population in the 18+ age group is the United Arab Emirates (UAE), at 124.6%.
87% of US adults use social media.
How many people use social media?
Understanding how many people use social media, the patterns that define its increased usage, and trends in how these platforms are used offer crucial insights for marketers, social media teams, and influencers alike.
In 2023, 4.89 billion people worldwide used social media. This number is expected to rise to almost 6 billion by 2027.
As of October 2024, the total number of active social media user identities stood at 5.22 billion, which equates to 63.8% of all the people on Earth.
A total of 94.5% of the world’s internet users use social media each month.
Among all the social media platforms available in 2024, YouTube became the most effective one for brands, with a 79% year-on-year growth. This means it has overtaken Instagram and Facebook despite the benefits of short-form video content.
Sources: Statista, Data Reportal, HubSpot
Social media growth over the years
As the statistics above show, social media usage is at an all-time high, with more than 63% of all people on Earth already actively using social media platforms. This section dives further into social media growth over the years to give you a clearer picture of the rate at which it’s being adopted.
256 million new identities joined social media platforms between October 2023 and October 2024. This equates to more than 700,000 new users every single day.
The number of social media users has steadily increased year on year. The list below gives you an insight into its use between January 2018 and January 2023.
2018 - 3,196 million
2019 - 3,461 million
2020 - 3,709 million
2021 - 4,199 million
2022 - 4,623 million
2023 - 4,760 million
As of 2023, China remained home to the biggest number of social media users, with the country’s entire user base surpassing 1 billion. Additionally, this number is set to exceed 1.2 billion by 2029.
By 2029, India is set to have the largest number of social media users worldwide, with its user base set to hit 1.3 billion.
Sources: Data Reportal, Kepios, Statista
Global social media growth trends
The rate of social media penetration varies from one region to another. Regions with greater access to smartphones and the internet are more likely to adopt social media in greater numbers than regions without such basic amenities.
As of April 2024, Northern and Western Europe had the highest social network penetration rates globally, reaching 80.2% and 78.2%, respectively.
Eastern Asia ranked third with a penetration of 74.9%, followed by Southern Europe at 73.5%.
Eastern and Middle Africa have the lowest reach, with 10.5% and 9.9%, respectively.
Africa, Asia, Oceania, and the Caribbean are the regions that fall below the global average of 62.2%.
As of January 2023, the UAE had the highest social media penetration rate, whereas Brazil and Morocco stood closer to the global average at 66.3% and 55.7%, respectively.
Sources: Statista
Social media usage by age group
The use of social media platforms also varies depending on an individual's age bracket. Those who fall under Gen Z and millennials are more likely to use social media than boomers and baby boomers.
The country with the highest social media adoption compared to the total population in the 18+ age group is the UAE, at 124.6%. These values sometimes exceed 100% due to various factors, including user misstatements, the use of fake accounts, and the differences between census data and true resident populations.
On the flip side, the country that ranks the lowest in terms of social media adoption is Eritrea in East Africa, with only 0.5% of the population in the 18+ bracket using social media. North Korea, however, stands at 0, but this is because social media platforms are blocked in the country altogether.
Among internet users aged 16 to 64, the amount of time spent on social media platforms stood at 01:37 (in hours and minutes) in Q3 2013 as opposed to 02:31 in Q3 2022. This demonstrates the extent to which social media platforms have become a greater part of our lives.
Sources: Keipos
Top countries for social media usage
Social media penetration varies depending on which part of the world you look at. Access to the internet, government-mandated restrictions, and cultural factors often play a key role.
Top countries by social media penetration
The countries with the highest social media penetration are in Northern and Western Europe and Northern America, with the UAE as a key outlier.
Northern Europe has the highest penetration rates of active social media users as a percentage of the total population, at 83.6%.
This is followed by Western Europe at 83.3% and Northern America at 73.9%.
Western Africa falls at the lowest end of the spectrum, at 13.3%.
The country with the highest social media adoption compared to the total population in the 18+ age group is the UAE, at 124.6%. These values sometimes exceed 100% due to various factors, including user misstatements, the use of fake accounts, and the differences between census data and true resident populations.
South Korea comes in second at 92%, Hong Kong comes in third at 89.9%, the Netherlands comes in fourth at 88.1%, and Canada comes in fifth place at 85.7%.
The worldwide average falls much lower, at 59.4%.
Sources: Kepios
Regions with emerging growth in social media
While the regions mentioned above already have high social media penetration rates, some are seeing growing numbers as a result of greater access to smartphones and the internet, along with other cultural factors.
India, for instance, has a social media penetration rate of 32.8% and has consistently grown over the past couple of years.
While Nigeria has the lowest social media penetration at 14.3%, it remains the country with the highest time spent on social media at 04:36. In comparison, the UAE, despite having the highest penetration, has an average daily time of 02:50.
Kenya, the Philippines, Brazil, and South Africa, despite having low social media penetration compared to European nations, have witnessed an increase in their use over the years and also take the top five spots in terms of the time spent on social media. Asia, Africa, and South America stand out as the regions with a growing adoption of social media platforms.
Source: Kepios, DemandSage
Gender-based social media usage
Social media usage also shows unique patterns in terms of gender. This aspect plays a key role, particularly when you consider economically weaker regions where the burden of labor is unequally divided between men and women.
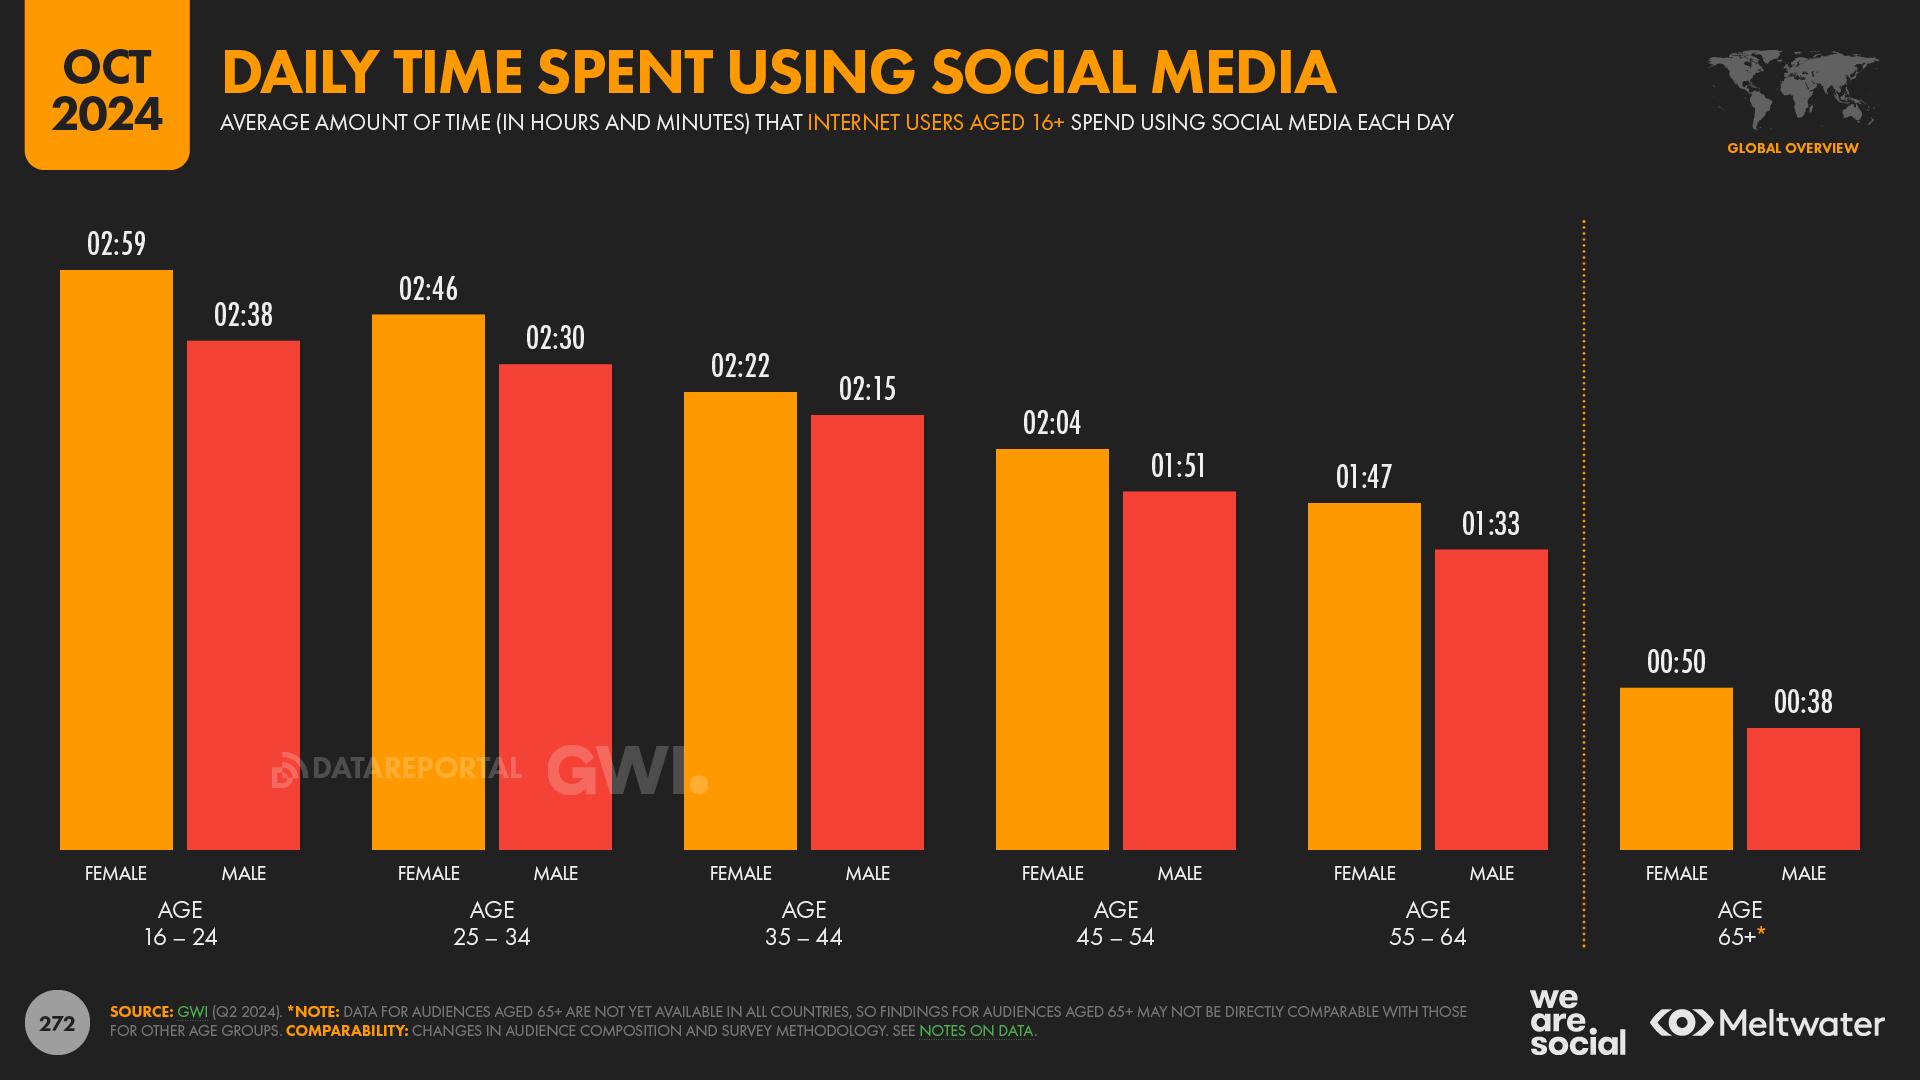
There are key differences in the daily time spent on social media among various age groups between 16 and 64, particularly between male and female users.
Among those between the ages of 16 and 24, males typically use social media for an average of 02:46, whereas females use it for about 03:11.
When it comes to the ages between 24 and 34, males typically use social media for an average of 02:42, and females use it for 02:56.
The time spent on social media progressively reduces the older the age group you consider. For instance, among those who fall in the age bracket of 55 to 64, males use social media for an average of 01:38, whereas females use it for about 01:40.
Sources: Kepios
Social media in the US
Social media platforms have risen in the US over the past couple of years, particularly given the popularity of short-form content. Other reasons include keeping in touch with friends and family, staying updated with the news, and so on.
87% of US adults use social media.
Facebook remains the most popular app among those older than 28, whereas TikTok is the most popular app among Gen Z social media users in the US.
Sources: HubSpot
Popular platforms in the US
As with every country, the US has its own preferences in terms of the most popular social media apps and their uses. While some use them as a source of news, others rely on them to connect with brands, follow influencers, or even for work-related activities.
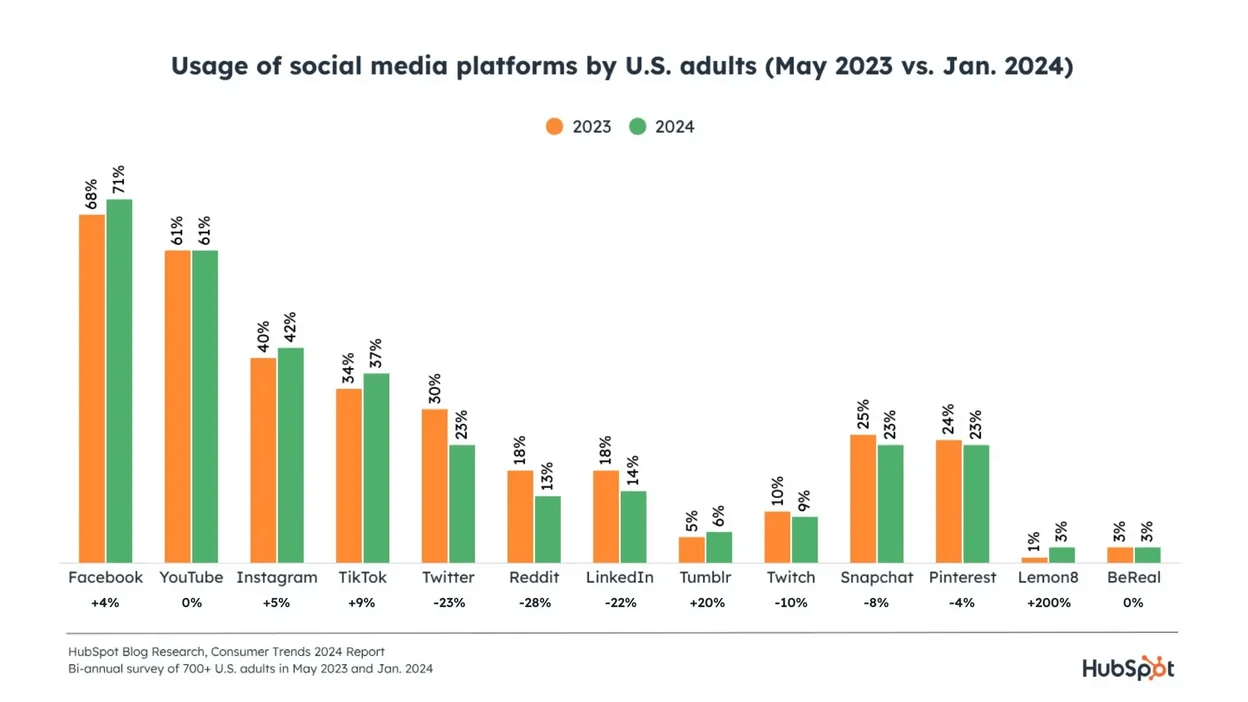
As of January 2024, Facebook remained the most popular social media app used in the US, with a share of 71%.
This was a 4% increase from the app’s usage, as recorded in May 2023.
YouTube is the second most popular app at 61%, whereas Instagram stands at 42%.
In terms of growth, the apps that saw the biggest increase in usage are Lemon8, with a 200% increase, Tumblr, with a 20% increase, and TikTok, with an 8% increase since 2023.
Social media usage by US demographics
Just as people in the US have a generic preference among the apps they prefer using, these preferences also vary based on demographics such as age, income, and whether someone lives in an urban or a rural setting.
The app with the highest usage among those between the ages of 18 and 29 is YouTube at 93%, whereas that with the lowest usage is BeReal at 12%. Facebook stands at 67%, Instagram at 78%, and TikTok at 62%.
YouTube continues to remain the most popular social media app among those between 30 and 49, at 92%. The same trend continues among 50-64, at 83%, and for those above 65, at 60%.
In terms of gender, Facebook is used by 59% of men and 76% of women. YouTube continues to retain its position as the most used app, with 82% of users being men and 83% of users being women.
In terms of their community, YouTube yet again retains its title as the most used app, with a user base of 85% in urban centers, 85% in suburban centers, and 77% in rural centers.
Sources: Pew Research Center
Most popular social media platforms
In terms of global trends, it’s always interesting to understand which apps are the most popular in terms of usage, advertising reach, and other metrics.
As of December 31, 2023, Facebook remained the most popular social media app with 3.07 billion monthly active users.
YouTube is the second most popular social media platform, with a monthly ad reach of 2.53 billion as of October 2024.
Instagram remains the most preferred social media application among men and women globally at 16.7%.
WhatsApp comes in second among the global favorites among social media platforms at 16%.
Facebook takes the third spot on this list at 13.2%.
Sources: Meta Investor Relations, Data Reportal
Time spent on social media
When you look at the statistics on time spent on social media platforms, you see an interesting picture that demonstrates the popularity of these apps and their ability to retain their audience’s attention for longer periods.
In terms of the average time per user spent on social media apps per month using Android apps, TikTok ranked #1 at 34 hours and 15 minutes a month.
YouTube came in a close second at 29 hours and 21 minutes a month, Facebook ranked third at 18 hours and 44 minutes a month, and WhatsApp Messenger ranked fourth at 16 hours and 52 minutes a month.
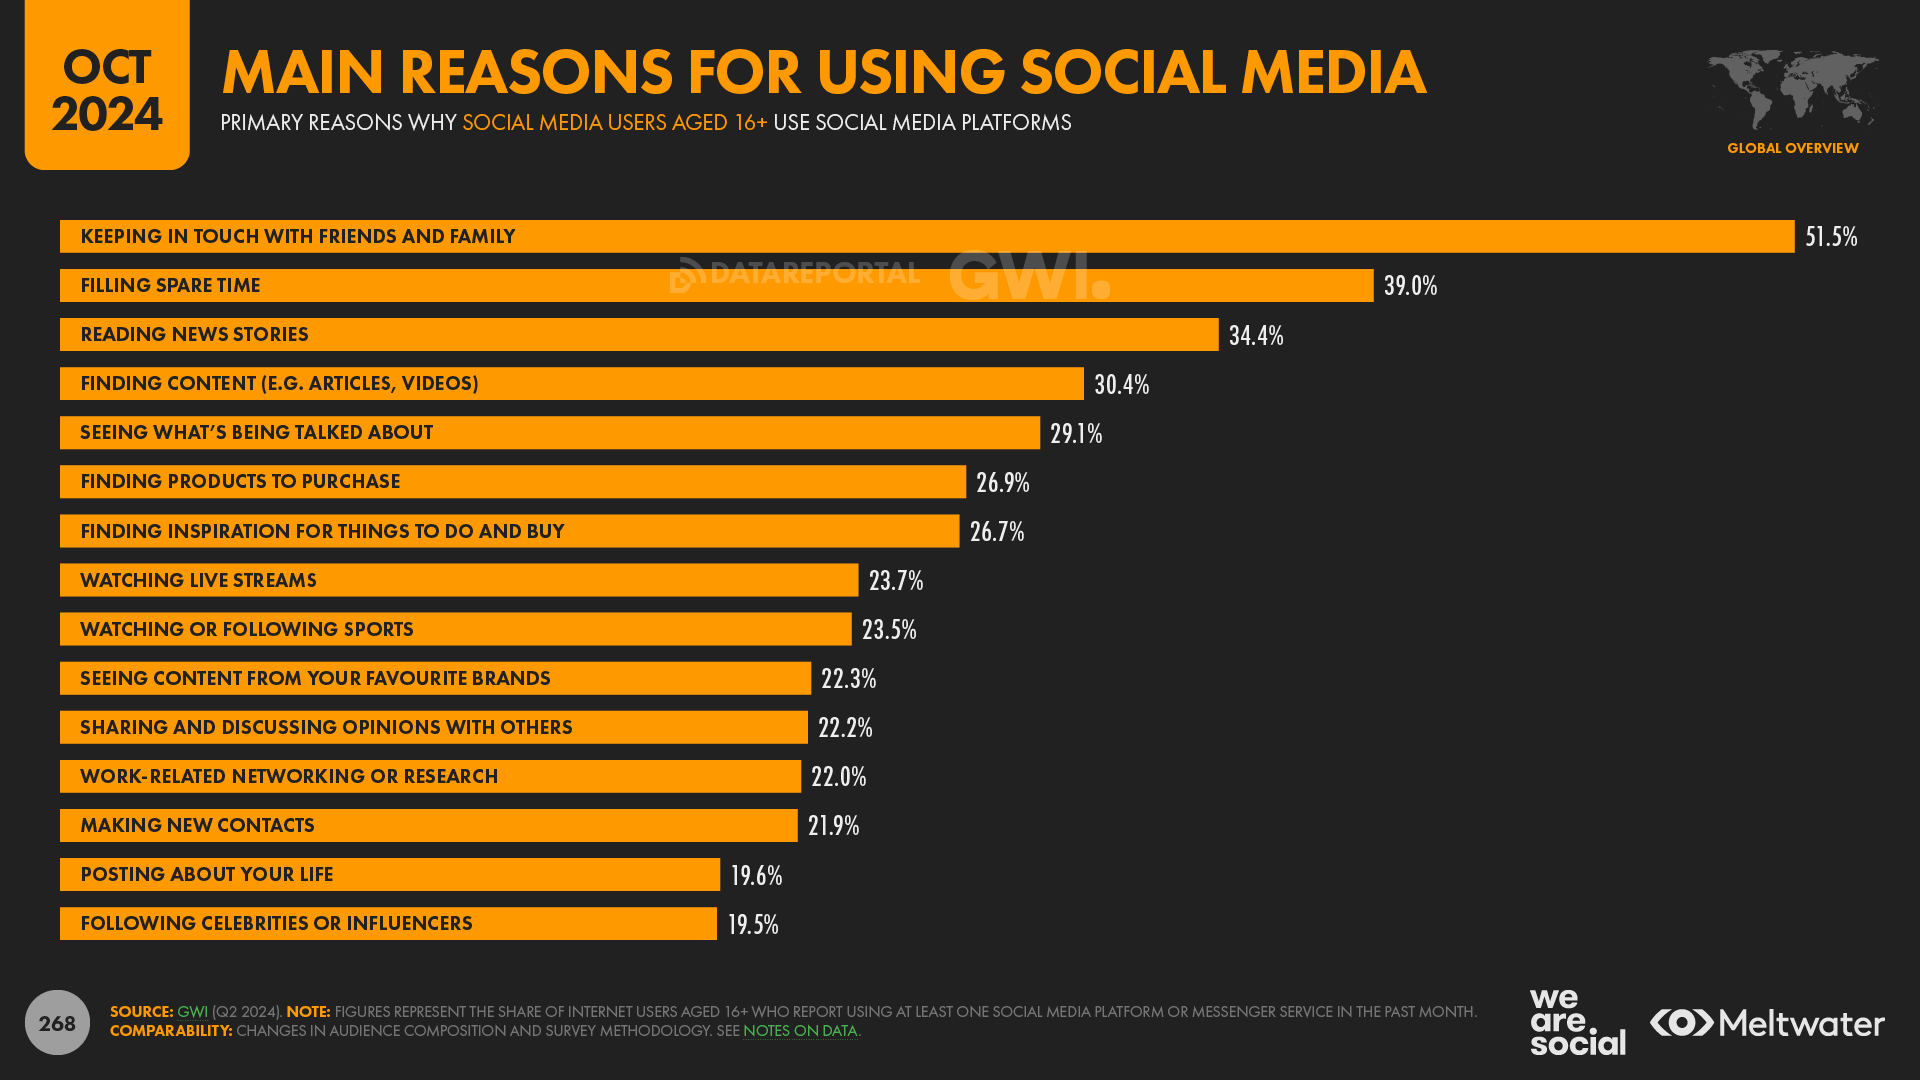
Of all the time spent on social media apps, 47.1% of people aged 16-64 stated that they use these platforms to keep in touch with friends and family, whereas 36.2% use them to fill in their spare time.
However, 34.2% of users stated that they use these platforms to read news stories.
Sources: Meta Investor Relations, Data Reportal
Social media usage trends to watch in 2025
The manner in which social media has changed over the years reflects the nature of the shifting use of technology as a whole. Until a few years ago, short-form content was unknown until TikTok made waves globally. Similarly, 2025 is set to witness certain trends in the use of social media that you should be aware of.
The rise of video content
Video content is popular and will remain so throughout 2025 due to its ability to capture users’ attention. It can also deliver a message or provide certain information in a short and concise manner.
95% of marketers state that long-form videos have average or high ROI, and this trend is set to continue in 2025, particularly since the majority of marketers believe that YouTube has the best audience-targeting tools.
96% of marketers even state that interviews, podcasts, and expert discussions have average to high ROI.
With consumers primarily conducting research via social media and videos rather than search engines, creating reviews or instructional content on products and services is considered one of the best actionable tips for increasing conversions via platforms like TikTok, Instagram, YouTube, or Facebook.
According to a whopping 36% of social media marketers, short-form video offers the highest ROI of any content format.
Sources: HubSpot
AI and personalized content
AI today is no longer a gimmick but a reliable tool that marketers and consumers use for various reasons. As a result, it’s set to play a key role in how both groups leverage social media platforms.
71% of marketers using generative AI to create content stated that it performed better than non-AI-generated content.
87% of social media marketers state that the use of AI tools will play a crucial role in developing a social media strategy in 2025. With AI becoming increasingly powerful and given its ability to personalize content, its use is set to increase in 2025.
Leaders recognize that while generative AI tools like ChatGPT can be helpful, their output wholly depends on the prompts used. Additionally, given that English isn’t everyone’s first language, using AI to create content across platforms will remain a key trend. In fact, the CEO of Datbox has even stated that his team uses ChatGPT to create content for posts on LinkedIn for the same reason mentioned above.
Sources: HubSpot
The impact of privacy concerns
Despite social media platforms' increasing benefits and their use of technologies like AI, user privacy concerns continue to play a key role in how individuals use these applications.
72% of Americans say that there should be greater government regulation on what companies can do with user data.
78% of Americans trust themselves to make the right decisions with respect to their data privacy.
On the flip side, 37% are unsure and overwhelmed by figuring out what they need to do, whereas 21% are confident that those who have access to their data will do what is right.
6 out of every 10 Americans skip reading privacy policies, while 22% read them sometimes, and 18% read them either rarely or never.
Sources: Pew Research Center
The bottom line
The use of social media at a personal and professional level is continuously changing. Just as a greater number of individuals are spending more time on social media apps, marketers are also realizing the benefits of leveraging these platforms to maximize their ROI. Short-form content is king today, and organizations across the globe are finding ways to connect with their customer bases using this format. This guide has offered key social media statistics as they exist today, along with key insights you should be aware of as we move into 2025.


