Read next: How to Transcribe & Translate Twitter Videos

50+ X (Twitter) Statistics & Facts Need to Know in 2025
98% accurate, real-time transcription in just a few clicks. 58 languages and multiple platforms supported.
When Twitter went public in November 2013, it had around 200 million users, but its history goes all the way back to 2006, when its CEO sent out the very first tweet on March 21. Over time, it has remained one of the most used social media platforms. I’ve used X (Twitter) for more than a decade now and have come to understand its algorithm and importance. To help you out, I’ve listed 50+ Twitter statistics you should know for 2025.
X (Twitter) stats top picks
As of May 2024, X (Twitter) had about 600 million monthly active users, over half of whom use the platform every day.
As of the beginning of 2022, users between the ages of 25 and 34 accounted for 38.5% of the platform’s global audience, while one-fifth of the users worldwide were between 35 and 49.
North America has the biggest share of X’s advertising audience at 19.4%, and Eastern Asia comes in second at 16.9%.
The worst day to post on X is Sunday.
About 545 million monetizable monthly active users on X (Twitter) exist.
Overview of X (Twitter)
The first set of statistics highlights X’s user base demographics and other such data.
As of May 2024, X had about 600 million monthly active users, over half of whom use the platform every single day.
The platform’s user base in the US has been declining since 2023, with 55.1 million monthly active users in 2023 and 50.5 million monthly active users in 2024.
X is among the US's six most popular social media platforms today.
As of the beginning of 2022, users between the ages of 25 and 34 accounted for 38.5% of the platform’s global audience, while one-fifth of the users worldwide were between 35 and 49.
Sources: Twitter, eMarketer, Statista
Key changes since rebranding
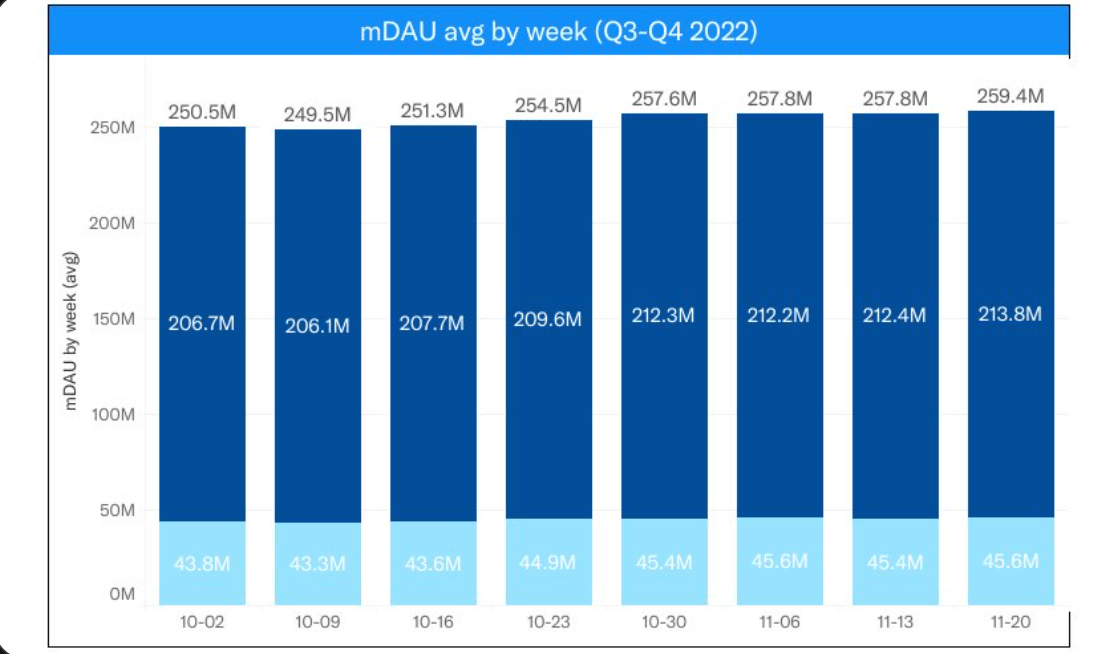
In a November 2022 tweet, Elon Musk stated that X had 254.5 million daily active users in the week before his takeover.
However, Linda Yaccarino, CEO of X, stated that the platform has 225 million daily active users as of November 2023, a decline of tens of millions since Musk’s takeover.
Sources: Mashable, Twitter, Twitter
How X compares with other platforms
As of April 2024, X was the 12th most-used social media app globally, with 611 million users. Between 1 October 2023 and 31 December 2023, the X app was used on 22.2% of smartphones.
YouTube, in comparison, was used on 100% of smartphones, while WhatsApp was used on 83.4% of smartphones. Among those between 16 and 64 years of age, 3% stated that X was their favorite social media platform.
Sources: Data Reportal
User demographics and distribution
Understanding the demographics and distribution of X’s users is also crucial for marketers who are looking to use the platform as a potential marketing channel.
Age demographics
Age demographics help marketers understand which age group is the most active and offers the most ad reach.
Twitter’s audience is largely younger, with those between 18 and 34 making up 54.8% of the platform’s users.
In 2021, Gen Z X users spent more time on other social media platforms, such as TikTok, YouTube, and Instagram, than on Twitter itself.
Sources: SimilarWeb, Statista
Gender distribution
The gender distribution of X users also affects advertising patterns and offers marketers helpful insights.
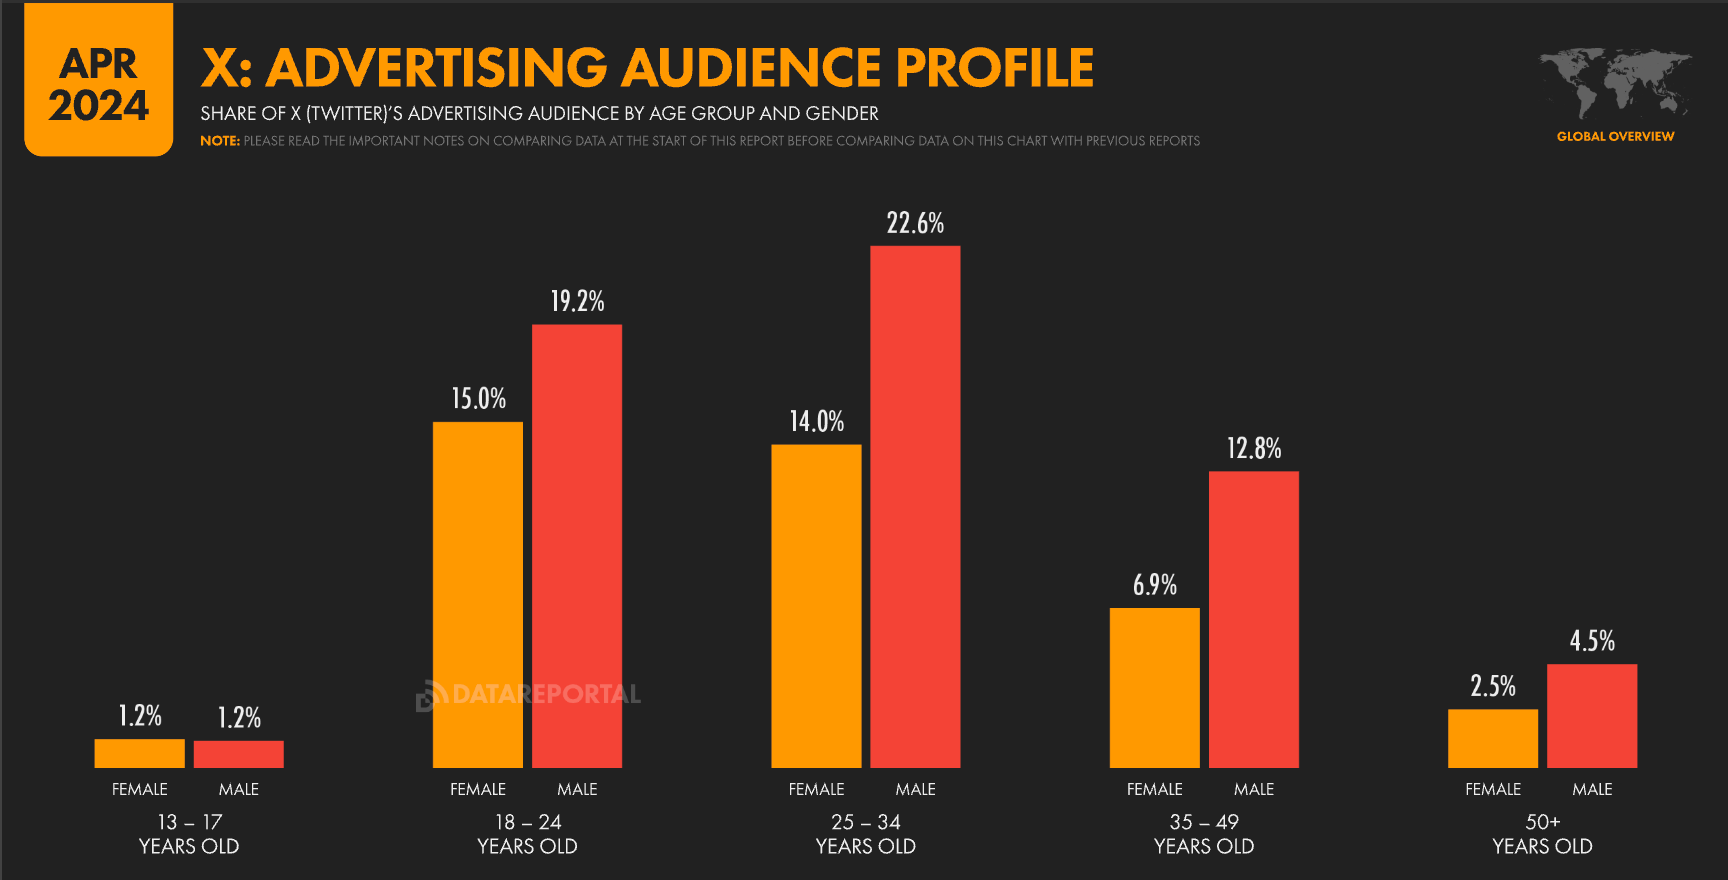
In the 18- to 24-year-old age group, males accounted for 19.2% of the platform’s advertising reach, while females accounted for 15%.
Among those between 25 and 34 years of age, males accounted for 22.6% of the platform’s advertising reach, while females accounted for 14%.
As of the beginning of 2022, men made up 56.4% of all X users worldwide.
Sources: Data Reportal, Statista
Location-based usage
Regarding location, X is much more popular in other countries than in the US.
Regarding the potential reach of X among those over 18, Singapore had the highest reach at 130%, followed by Hong Kong at 102.7%.
Reach in the USA stood at 38.1%, while the worldwide average was 9.9%.
Sources: Data Reportal
X (Twitter) growth and usage statistics
In this section, I list some key statistics about the platform’s growth and usage worldwide and in the US.
Monthly active users (MAU)
X has about 600 million monthly active users as of May 2024.
The biggest share of X’s advertising audience is in North America at 19.4%. This is followed by Eastern Asia at 16.9%.
Regarding the average time per session spent using the platform’s mobile app, New Zealand ranked #1 at 09:07, while Japan came in second position at 08:23.
Sources: Data Reportal, Twitter
Time spent on X
X CEO Linda Yaccarino stated that users spend more than 7.8 billion active minutes on the platform each day.
The average user spends 32 minutes a day on X.
Sources: Twitter
Twitter usage in the US
The US has the biggest share of X users globally.
In terms of X’s total ad reach, the USA comes in first place with 106,230,000, a 0.8% increase QoQ.
A big chunk of Twitter’s growth is now happening outside the US in countries like Japan, India, and Indonesia, among others. However, the US still has the highest number of users, considering it is also the platform’s country of origin.
Sources: Data Reportal
Comparison of past years’ growth
Regarding the platform’s user base growth, X has a daily active user base of 109 million in Q1 2017. This rose to 120 million in Q1 2018 and 166 million in Q1 2020. As of September 2023, X has a daily active user base of 245 million.
Sources: Statista
Content and engagement statistics
Understanding how users engage with X and the different content formats it offers also helps markets allocate their resources effectively.
Popular content formats
X offers multiple content formats, including Spaces, videos, threads, and more. Here are a few key insights into these formats and the engagement they generate:
According to X, 80% of its user sessions include watching videos, making them one of the platform's most popular content formats.
Further, immersive video has more than 100 million active users daily.
84% of X posts are replies, retweets, or quote tweets.
Only 15% are original posts by users.
Sources: Twitter, Twitter, Pew Research Center
Engagement rates and best posting times
What are the engagement rates on X, and how do they compare with other social media platforms? This section offers some key answers to these questions, along with the best times to post on the platform.
In December 2023, the X web page had 6.2 billion website visits worldwide. This was an increase from 5.9 billion the previous month.
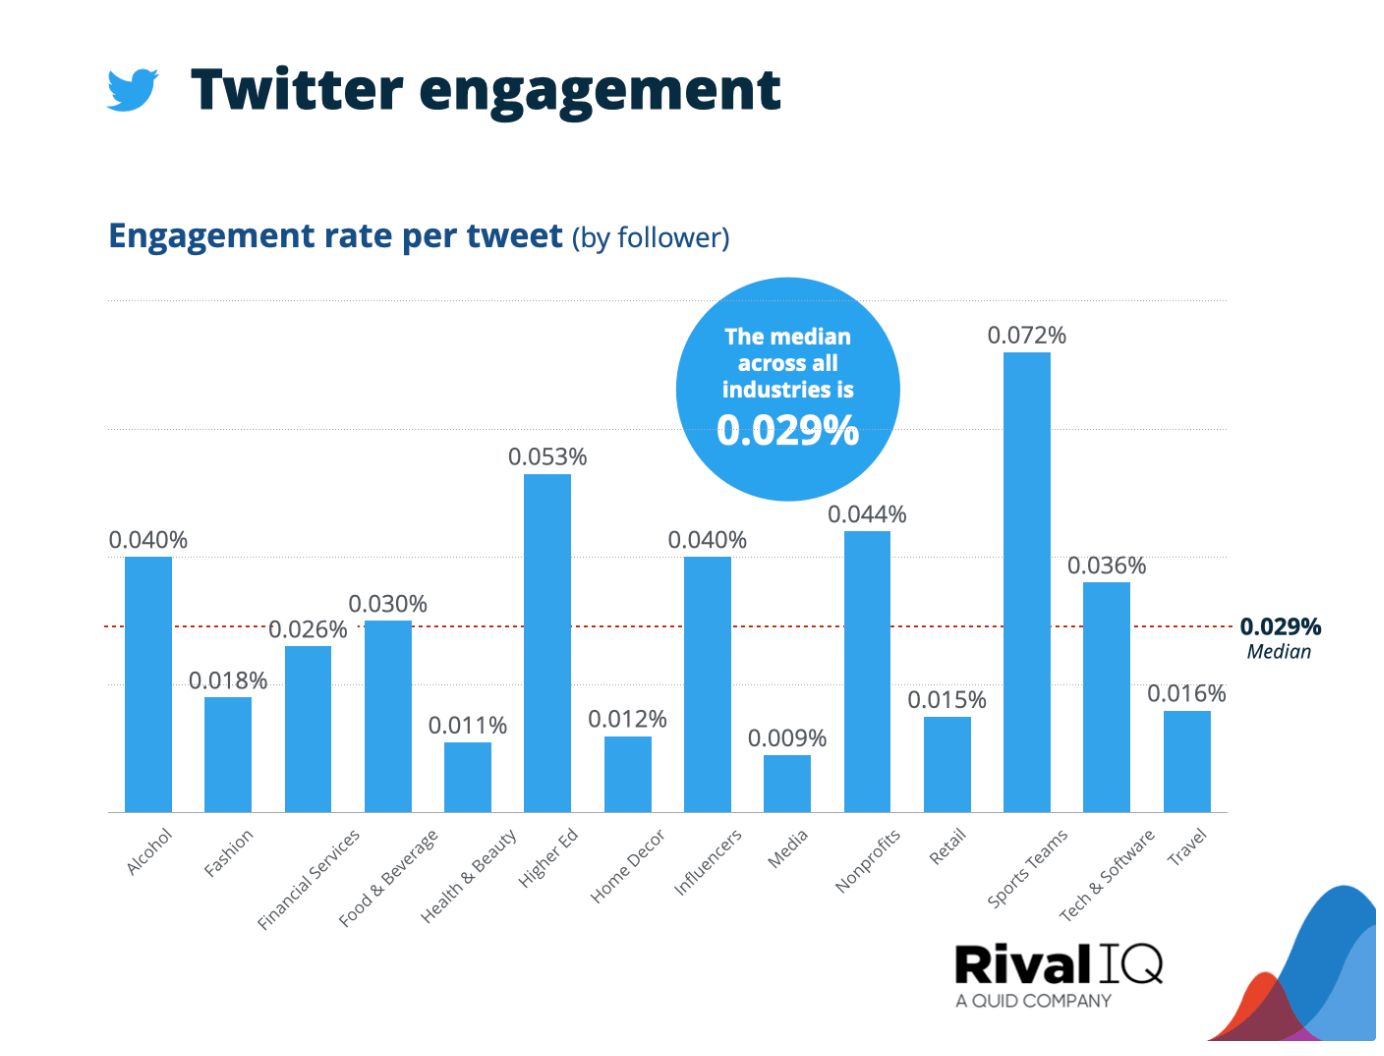
However, one study revealed a 20% decline in the platform's engagement rate, with the average engagement across industries being 0.029%.
The median across all industries is 3.31 tweets per week.
The best time to post on X varies based on the day. Here’s a breakdown:
Monday: 10 am to noon
Tuesday: 9 am to 3 pm
Wednesday: 9 am to 3 pm
Thursday: 9 am to 3 pm
Friday: 10 am to noon
The worst day to post on X is Sunday.
Sources: Rivaliq, Statista, SproutSocial
Hashtags trending topics and keyword usage
Knowing which hashtags and topics are trending is critical for businesses to stay relevant on social media. The statistics below offer some key insights that businesses can leverage.
59% of X users get the news on the platform.
Additionally, while YouTube and Facebook outpace other sites in terms of where Americans get their news, 12% regularly get their news from X.
64% of men get their news from X, while 36% of women use the platform to access the news.
Sources: Twitter, Pew Research Center
Twitter Spaces and audio content
Social audio was one of the more recent introductions to social media apps, with X launching Spaces in response to the introduction of Clubhouse. Spaces enabled live audio conversations on both iOS and Android devices running X.
The company began testing this feature in 2020 with a small group of users before opening it to all users with over 600 followers in 2021. While it was adopted by a small group of the platform’s users, the company's mainstream adoption still leaves much to be desired.
Impact of Spaces on user engagement
One of the benefits of Twitter Spaces was that it allowed businesses to tap into the platform’s already engaged user base and removed the exclusivity barrier that Clubhouse came with. Everyone from businesses and politicians has used this feature to interact with users live.
Notta can convert your spoken interviews and conversations into text with 98.86% accuracy in minutes. Focus on conversations, not manual note-taking.
Twitter for business and marketing
Besides being a social media platform, X is a critical marketing channel for businesses in several industries. Here are a few statistics highlighting its potential for advertisers and the platform's features for businesses to leverage.
Advertising statistics
What is the scope for advertising on X? The following statistics offer crucial insights into the platform's advertising landscape and trends in ad revenue.
As per Twitter, there are about 545 million monetizable monthly active users on the platform.
Ads on X saw a 22% increase in total engagement in 2023.
X’s ad spend revenue is expected to drop by 2% this year and 4% in 2025.
According to eMarketer, 32.4% of the ad spend on X comes from the media sector.
Sources: Twitter, Twitter, eMarketer, eMarketer
Organic vs. paid reach
Understanding the scope for organic and paid reach also helps businesses develop targeted strategies to market themselves on X.
34.9% of users on X follow or research brands and products.
Only 30% of social marketers are confident that they get a positive ROI from X.
Many suspect that the introduction of Premium+ will have a major effect on organic reach, as users' content will be pushed lower and ads will be removed from the ‘For you’ page.
Sources: Twitter, Data Reportal, HootSuite
Business-specific features on X
X has consistently offered businesses a host of features that allow them to effectively market their products and services to their target audiences. Here are a few key features businesses can benefit from:
Radius targeting: This feature allows local businesses to target potential customers who live in nearby regions.
Keyword ads: ROI advertisers can place their ads next to relevant conversations and search results in real-time.
Account highlights: This feature gives small businesses automated recommendations for their campaigns, including potential issues with their accounts and how they can improve them.
Other key business features include 1 Click Policy Appeals, Pixel Diagnostics Tracker, X’s Supply Side Platform, and Grok.
Sources: Twitter
Twitter algorithm updates and ranking factors.
Like any other social media platform, X’s algorithm is also routinely updated for the best user experience. In the sections below, I offer some key insights into the platform’s algorithm and how you can make the most of it.
Key algorithm changes in 2024-2025
In 2017, Twitter introduced the relevance model in its algorithm. This model showed users what they missed out on based on ‘relevance’ rather than merely showing them updates in chronological order. This trend continues in 2024, with users being shown content that’s most relevant to them when they open the app or the website.
In 2023, Elon Musk also posted on X that the company was tweaking the algorithm to highlight content from smaller accounts outside of a user’s friend-follow list.
X also favors rich media content such as GIFs, images, and videos. As a result, content with visual elements generally drives more engagement than content with text.
Best practices for content optimization
To make the most of your presence on X, you need to ensure that your content and profile (individual or business) are optimized. Here are a few practices that can help you out:
Create interactive content: With X favoring visual and interactive content, there’s no reason why you shouldn’t capitalize on this. There are various ways to boost engagement, such as live interviews, company Q&As, polls, and quizzes.
Short-form video: Short-form videos have taken over every social media platform today, and the same holds true for X. They’re engaging and, when done right, can effectively elicit the emotion you want in your audience.
A well-optimized profile: Optimize everything from your username, bio, profile picture, header image, and even the links you add. Each element plays a key role in ensuring a well-optimized profile that leads to conversions.
The bottom line
The key to making the most of your presence on X is understanding the key trends on the platform and in your industry. Additionally, understanding what kind of content your audiences prefer and how they engage with them can help you achieve a higher ROI on X. I’ve listed some of the most important Twitter statistics in this guide so you can get started.


