40+ Fascinating Amazon Statistics Sellers Need to Know in 2025
Record, transcribe and summarize conversations with one click.
Amazon was founded as an online bookstore in 1994 but soon became what it aptly calls itself—The Everything Store. Today, this global e-commerce powerhouse sells electronics, media, books, delivery, retail goods, and so much more. As a seller, staying up to date with the details of the company, its growth, policies, and so on is crucial. To help you out, I’ve listed 40+ Amazon statistics you should know as we head into 2025.
Amazon stats (top picks)
In 2023, Amazon accounted for 37.6% of the US e-commerce market, with Walmart coming in second at 6.4%.
28% of customers complete a purchase on Amazon in three minutes or less, while 50% make a purchase within 15 minutes.
The biggest proportion of Amazon sales comes from those between 25 and 34 years of age, at 28.81%.
As of 2022, 64% of merchants relied on Amazon’s FBA to fulfill their orders.
Amazon dominates the US smart speaker market. 67% of respondents state they own an Amazon Echo, compared to 27% who own a Google Home and 21% who own an Apple HomePod.
Amazon’s marketplace overview
Over the course of my career as a marketer, I’ve relied heavily on Amazon to market a range of products and services and have come to understand the platform well. An overview of Amazon requires knowing its market share, daily user numbers, revenue, and growth trends.
Amazon’s market share
When it comes to online sales, Amazon is the biggest player in the market. Here is what the Amazon market share looks like:
In 2023, Amazon accounted for 37.6% of the US e-commerce market, followed by Walmart at 6.4%, Apple at 3.6%, and eBay and Target at 3% and 1.9%, respectively.
The United States is Amazon’s most profitable market, having generated over $356 billion in 2022.
Amazon’s daily user numbers
Amazon ships to users in more than 100 different countries and regions.
Customers complete 28% of all Amazon orders in three minutes or less, and about 50% of people purchase in less than 15 minutes.
In 2022, Amazon was even ranked the most trusted brand by consumers in the US.
Amazon’s revenue and growth trends
Amazon is one of the biggest public companies in the world in terms of revenue. The statistics below outline Amazon's daily revenue and growth over the years.
Amazon is the third largest public company in the world in terms of revenue after Walmart and China’s State Grid. Its revenue stood at $8.4 billion in 2005 and shot up to $574.9 billion in 2023.
Since it is based in the US, North America alone generated a majority of the company’s net revenue in 2023, at $353 billion.
According to Amazon itself, more than 60% of the sales in the Amazon store came from independent sellers.
Sources: Statista, Statista, Amazon
Amazon customer demographics
Understanding the demographics of Amazon’s customers is crucial to understanding their preferences, which allows you to target them effectively. In the three sections below, I break down everything you need to know about their demographics.
Age and income breakdown
According to October 2024 data, 16.18% of Amazon’s customers are between the ages of 18 and 24.
The biggest proportion of sales, 28.81%, comes from those between 25 and 34 years of age.
Those between 35 and 44 make up 19.57% of the company’s customers.
23% of Amazon’s customers are from low-income households or those that earn less than $40K a year.
Middle-income customers, who make up 48% of Amazon’s customer base, earn between $40 and $125K.
High-income individuals or those who earn more than $125K make up 9% of Amazon’s customer base.
Sources: SimilarWeb, Numerator
Regional popularity and user preferences
In terms of web traffic to Amazon’s website, 84.5% comes from the United States, followed by India, which has a mere 1.19%. Web traffic from Canada was clocked at 0.99% as of October 2024.
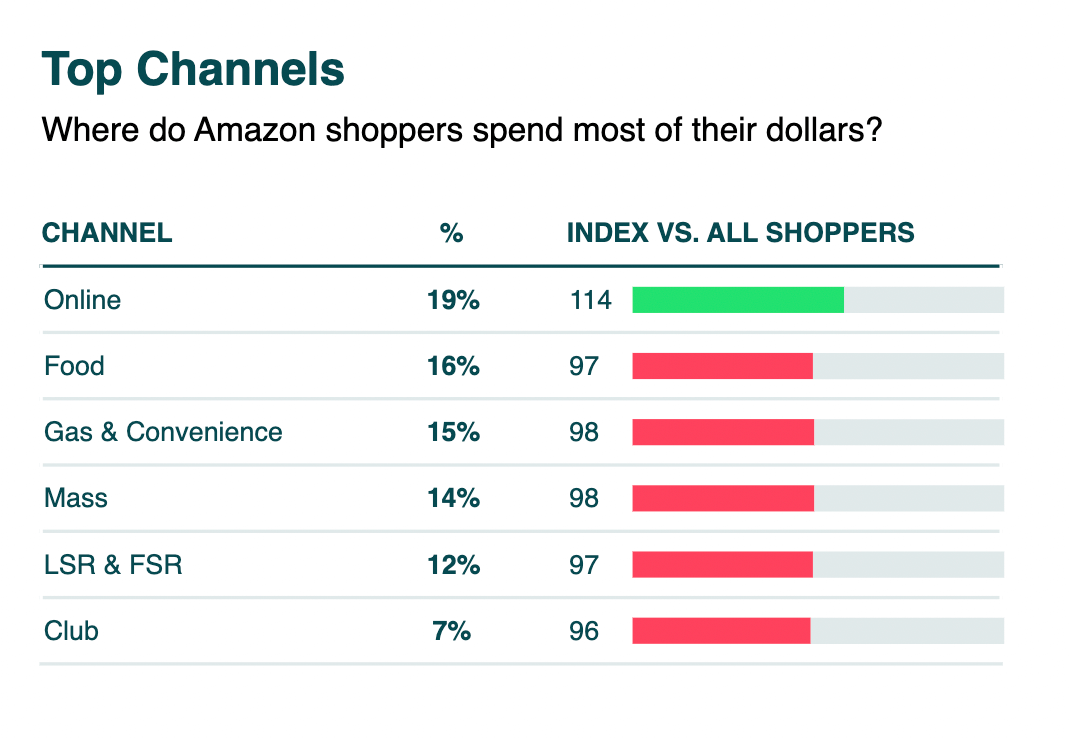
19% of Amazon’s customers spend their money online, while channels like food and gas & convenience are 16% and 15%, respectively.
 Sources: SimilarWeb, Jungle Scout, Numerator
Prime membership and its influence
What impact has Amazon's Prime membership had on the company’s growth and customer purchasing behavior? Here are a few numbers.
According to Amazon, the company has over 200 million Prime shoppers worldwide.
In fact, the United States alone is said to have a Prime subscriber count of about 180 million, and 75% of the country’s shoppers are Prime members.
A survey conducted on the major reasons for purchasing a Prime membership found that the two most popular reasons were free shipping (57%) and access to Amazon Prime Video (14%).
Sources: Amazon, Statista, Statista
Amazon product and sales statistics
Besides its customer base, understanding Amazon’s product catalog, sales, and popularity in terms of categories is also essential. These are broken down into the four sections below.
Total products listed on Amazon
Amazon has over 350 million products listed on its website.
Sources: Amazon
Best-selling product categories
35% of Amazon’s SMB sellers sell in the Home & Kitchen category due to the ease of manufacturing, consistent demand, and durability during delivery, among others.
The five most shopped categories from US sellers include Health & Personal Care, Beauty, Home, Grocery, and Apparel.
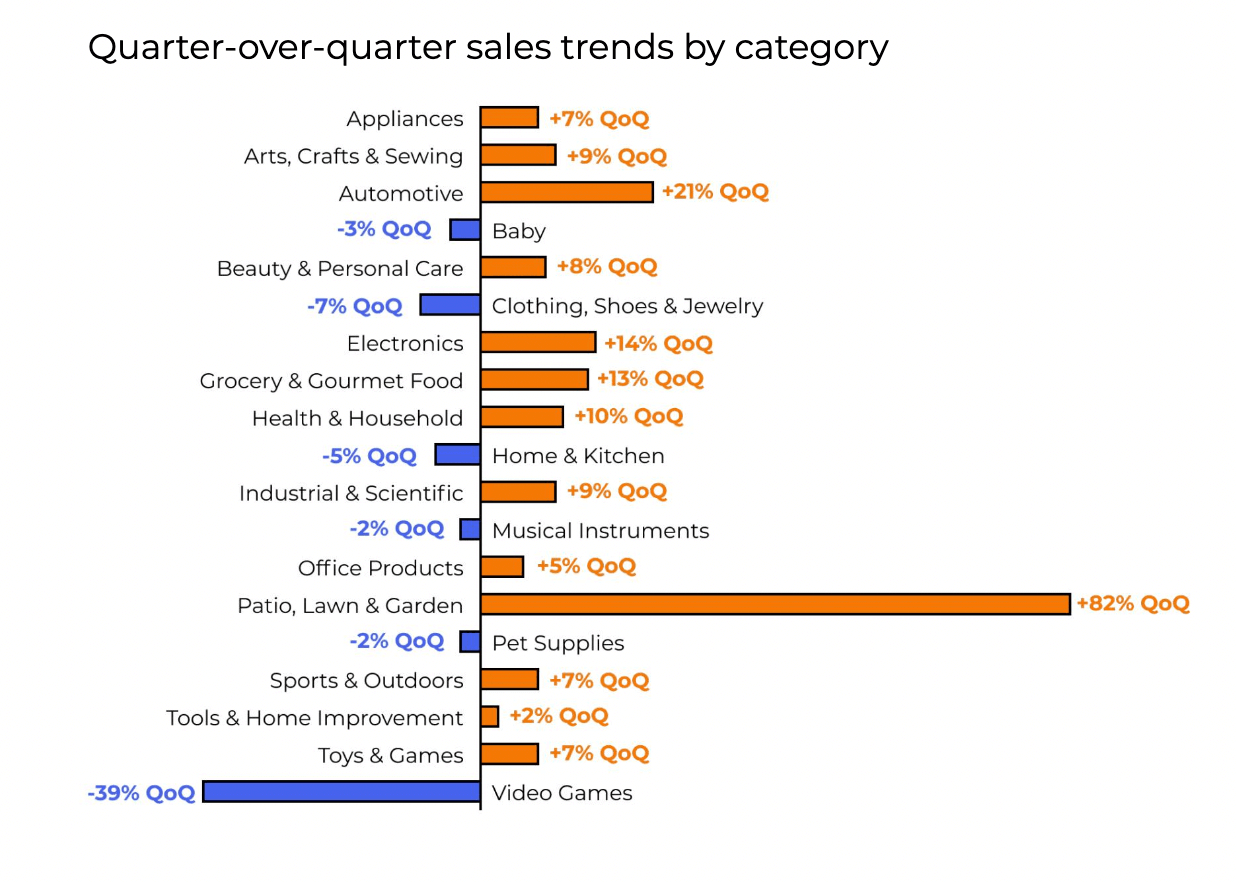
According to Jungle Scout’s report, the category with the increase in sales was Patio, Lawn & Garden, with an 82% increase in QoQ.
 Sources: Amazon, Jungle Scout
Daily sales volume and transaction count
How many products does Amazon sell per day, and how much money do sellers make? Here’s what you need to know.
In 2023, independent US sellers sold over 4.5 billion items, an average of about 8,600 every single minute.
Amazon topped the charts for online retail spending in Q2, with 53%. Walmart was in second place, with 32%.
Sources: Amazon, Jungle Scout
Third-party vs. Amazon-owned product sales
What is the difference between the sales made from third-party sellers and Amazon’s own products?
As of Q2 of 2024, Amazon sold 61% of paid units from third-party sellers.
Taking these into account, sales of Amazon’s own products for the same quarter can be pegged at 39%.
Sources: Statista
Amazon seller demographics and growth
Besides Amazon’s customer demographics, knowing its seller’s demographics and other information about them can also help you understand the brand better. I present all the information you need in the three sections below.
Number of Amazon sellers globally
Knowing how many sellers on Amazon list their products is crucial to knowing which categories offer the most potential.
Small and medium-sized businesses account for 1.9 million sellers and comprise 60% of the retail sales on the platform.
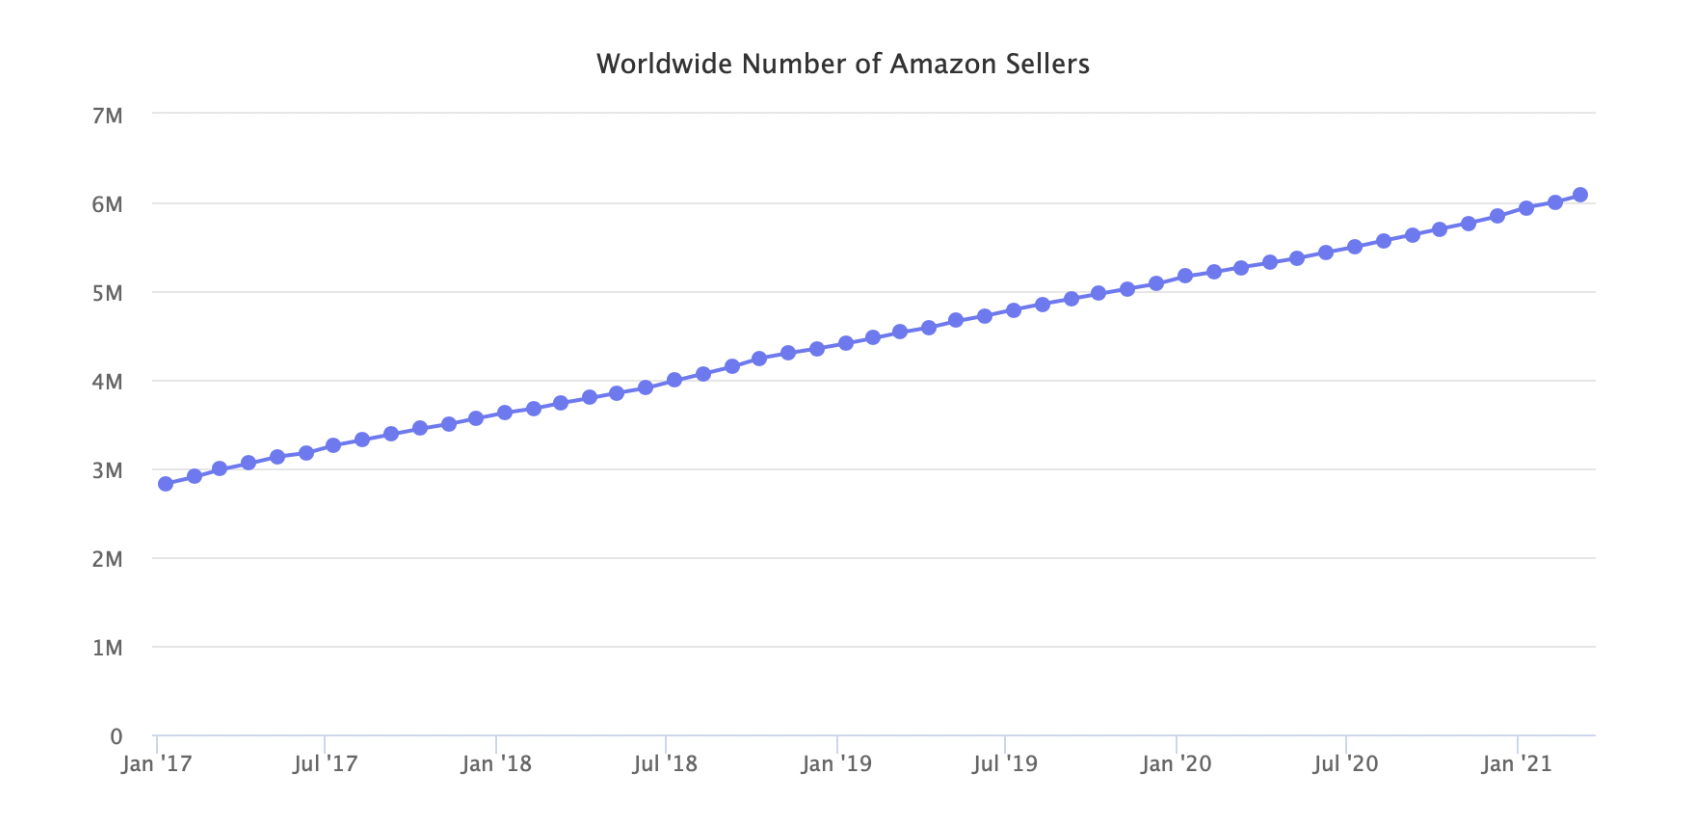
According to data from 2021, Amazon had 6,090,000 sellers worldwide, with those in the US, Canada, and Mexico making up the largest marketplace with over 3 million sellers.
Sources: Amazon, Marketplace Pulse
Seller growth and revenue trends
How has Amazon’s seller base grown over the years, and what trends can you identify in terms of the revenue they generate? Here are a few numbers.
As of 2021, Amazon had roughly 3,119,000 sellers in North America, a 10% growth from the previous year.
The market with the biggest growth in sellers was Singapore, with a 222% growth between 2020 and 2021, taking the number up from 11,000 to 16,000.
The Middle East came in second with a 125% growth, taking the number of sellers up from 40,000 to 72,000 within the same period.
US-based sellers averaged over $250,000 in annual sales on the platform in 2023.
Over 10,000 independent sellers even surpassed more than $1 million in sales on Amazon’s store for the first time in 2023.
 Sources: Marketplace Pulse, Amazon
Fulfilled by Amazon (FBA) vs. seller-fulfilled models
How many sellers prefer Fulfilled by Amazon (FBA) when compared to other fulfillment models? Here are the key statistics:
As of 2022, the FBA model caught on, with 64% of merchants relying on Amazon to fulfill their orders.
22% of sellers stated that they combined this with their own third-party handling mechanisms, including storage, shipping, and customer service.
Shipping by FBA also costs up to 70% less per unit when compared to options provided by other US fulfillment services.
With Notta, you can easily generate meeting minutes, turning spoken content into written records with 98.86% accuracy.
Amazon advertising statistics
Amazon has become one of the biggest players in the digital advertising landscape. Here are a few Amazon advertising statistics you should know about and how they impact seller revenue.
In 2023, Amazon’s global ad revenue reached a whopping $49 billion, nearly thrice the amount it generated in 2019.
Due to its widespread advertising efforts, it attracted 75% of the US digital retail media spending in 2023.
In 2022, Amazon accounted for 11.8% of the total digital advertising spending in the US. This share is expected to increase to 15.2% in 2025.
According to the findings of a 2022 benchmarking report, sellers who used Sponsored Product campaigns through Amazon Ads spent anywhere less than 13-79% more than alternatives like Google, Facebook, Instagram, LinkedIn, and Walmart.
Sources: Statista, Statista, Sellics
Amazon device usage and access methods
What devices do users access Amazon from? This section explores this question in detail and highlights the use of voice search and Alexa.
Mobile vs. desktop shopping trends
In October 2023, mobiles had a market share of 52.69%, which had risen to 61.59% in October 2024.
In comparison, desktops accounted for 45.54% of the market share in October 2023. This number has declined to 36.56% in October 2024, signaling a higher percentage of users relying on mobile phones to access Amazon.
In the six months before December 2023, direct visits via desktops to Amazon.com stood at 6.1 billion.
Millennials accounted for about three-quarters of the respondents, who stated they prefer using their smartphones.
Sources: Statcounter, Statista, Statista
Voice search and Alexa integration
While mobile phones are largely preferred over laptops or desktops when accessing Amazon, what do the numbers say about voice search and Alexa use?
The use of voice assistants is most popular among those between 35 and 44 years, with the female share amounting to 33.7% and the male share at 32.5%.
China ranks #1 in terms of the use of voice assistants to find information, with 27.4% of its population using voice assistants. The US comes in second, with 25.5%, while the worldwide average is 20.5%.
According to the Voice Consumer Index 2022, the Amazon Echo and its assistant Alexa are the most popular smart speakers in the US.
Amazon dominates the smart speaker market in the US, with 67% stating they own an Amazon Echo. In comparison, 27% own a Google Home, while only 21% own an Apple HomePod.
Sources: Data Reportal, Vixen Labs, Statista
The bottom line
Selling on Amazon has become one of the best mechanisms for sellers to leverage for 2025, and with services like FBA, the cost of selling becomes much cheaper than other alternatives. However, creating a winning selling strategy on this platform demands that you keep yourself updated with the latest Amazon statistics. I’ve listed 40+ statistics in this guide that can help you. Read through them carefully to create a well-rounded strategy that can help you maximize your profits in 2025.