60+ Apple Statistics for 2025: Users, Revenue & Growth
Record, transcribe and summarize conversations with one click.
Apple is one of the world's biggest and most recognizable tech companies. Since its founding in 1976, it has been one of the foremost players in technology, innovating well-known devices such as the iPhone, iPad, and, most recently, the Apple Vision Pro.
Tech industry analysts or marketers should know all the essential information about this brand. I’ve been following Apple’s growth over the years and compiled 60+ Apple statistics that you should know for 2025.
Apple.Inc stats (top picks)
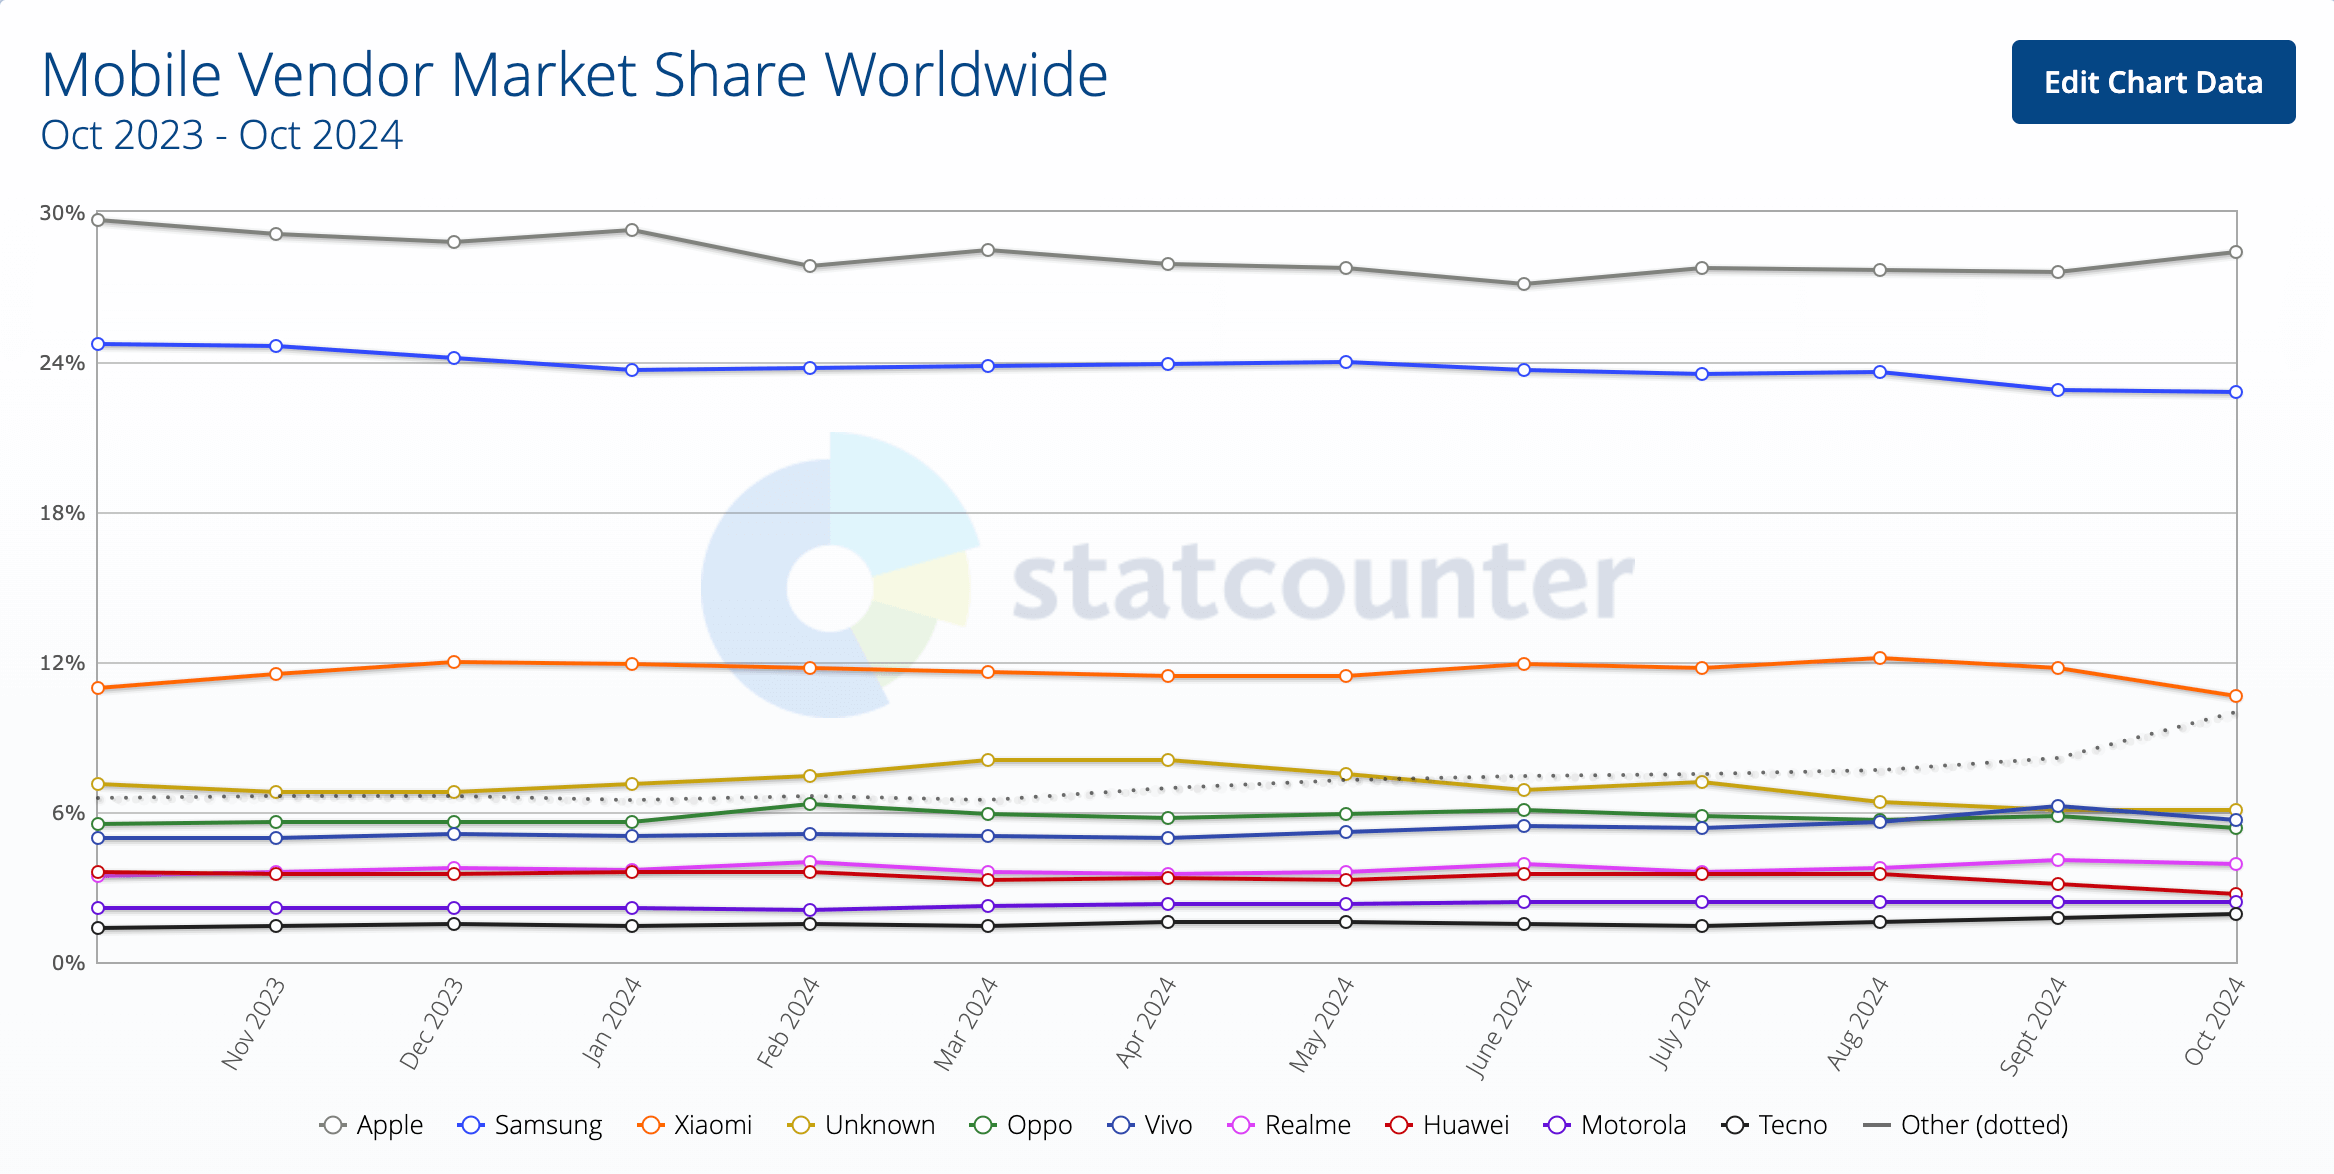
As of October 2023, Apple had the biggest share of any mobile vendor at 29.65%.
Apple’s annual revenue stood at $383.29 billion in 2023.
The iPhone’s market share rose from 3% in 2007 to 18% in 2011 and 2012. Today, it is the biggest player in the market, with a share of 17.7%.
271 movies and TV shows were available on Apple TV as of March 2024.
Apple has avoided 18.5 tons of carbon emissions as a part of its Supplier Clean Energy Program in 2023.
Apple’s market presence and growth
To understand Apple's size as a company, you must know its market share, revenue, and profitability. In the three sections below, I will discuss its market presence and growth over the years.
Global market share and penetration
Apple’s global market share and its penetration are important pieces of information for anyone interested in the company.
Apple dominates the worldwide market and has the biggest share of any mobile vendor. In October 2023, it had a market share of 29.65%.
By October 2024, its market share fell slightly to 28.38%. However, it beat its nearest competitor, Samsung, by a fairly large margin, given its market share of 22.82% as of October 2024.
Apple’s iOS also holds the largest share of the smartphone operating system market in the US, claiming more than half of the market as of March 2024.
Given its pricing, however, Apple’s popularity declines in less prosperous regions of the world. For example, the iOS market share in Africa was 13% as of November 2023, with Android dominating at an 85% share.
 Sources: GAStatCounter, Statista, Apple
Revenue and profitability
The annual Apple revenue stood at $383.29 billion in 2023.
This accounted for a 2.8% decrease from the previous fiscal year.
Apple’s revenue, as reported in 2020, stood at $274.52 billion. It increased to $394.33 billion in 2022 and then fell to the amount it registered in 2023. However, for 2024, it has reported a revenue of $391 billion.
Sources: Apple, Stock Analysis, Statista
Customer loyalty and brand perception
According to one source, Apple has a Net Promoter Score (NPS) of 68.
As per the Bloomberg Intelligence iPhone Survey, Apple’s loyalty sits at 93% based on responses from 1600 respondents.
Apple product statistics
Apple sells a range of products, each with a huge market. The next three sections explore the market share of Apple’s top products and related data.
iPhone usage and market trends
The iPhone is #1 among the top 5 best-selling Apple products. Here are a few key things you need to know about the iPhone’s usage and its market trends:
In 2023, the iPhone 14 was the best-selling smartphone, with a market share of 3.8%. In 2024, the iPhone 15 took the top spot, with a market share of 3.5%.
The iPhone 16 sales numbers also led to a less strong performance in the first quarter of 2024. As a result, Apple came in second position in terms of quarterly global unit shipments after Samsung.
According to well-known Apple analyst Ming-Chi Kuo, sales of the iPhone 16 are down compared to last year. CNN also reported that pre-sales on the first weekend were pegged at 37 million units, 12% down from the same period last year.
As per a study conducted by Statista, workers in Turkey needed to work for 73 days to buy the iPhone 16 Pro. In contrast, workers in Switzerland only needed to work for four days.
In terms of the share of smartphone shipments, Apple had a market share of 17.7% in Q2 2024, while Samsung took the first spot with a market share of 18.3%.
The iPhone’s market share in 2007 was 3%, but it quickly rose to 18% in both 2011 and 2012.
Sources: Ming-Chi Kuo, CNN, Statista, Statista, CounterPoint Research, Statista
iPad and Mac statistics
As of Q4 2023, Apple led the global tablet market with a market share of 40.6% and shipped a total of 14.9 million tablets.
This declined from the 21.1 million tablets it shipped as of Q4 2022. The decline was due to a worldwide decline in tablet shipments in the past few months, which resulted in a -29.3% growth YoY.
As of Q1 2024, Apple had a market share of 8.1% in the global PC market, taking the fourth position after Dell, HP, and Lenovo in the third, second, and first spots, respectively.
Apple Watch, AirPods, and wearables
The Apple Watch and the AirPods are other key devices in the brand’s product lineup. Here is what the statistics say about their share in the global market:
First introduced in 2015, the Apple Watch sold 54 million units in 2022, a number that declined to 38 million units in 2023.
Apple leads the way in the True Wireless Stereo (TWS) headset market, accounting for 17% of the market share as of the second quarter of 2024.
Apple services and digital offerings
Besides its mobile and other devices, Apple also offers other services, such as Apple TV, among other digital offerings. I list some important insights in the next two sections:
Watch time and content preferences
As of March 2022, the number of paid Apple TV subscribers amounted to 25 million.
An additional 50 million accessed Apple TV via promotions, as the service is made available to customers for a year when they purchase Apple devices.
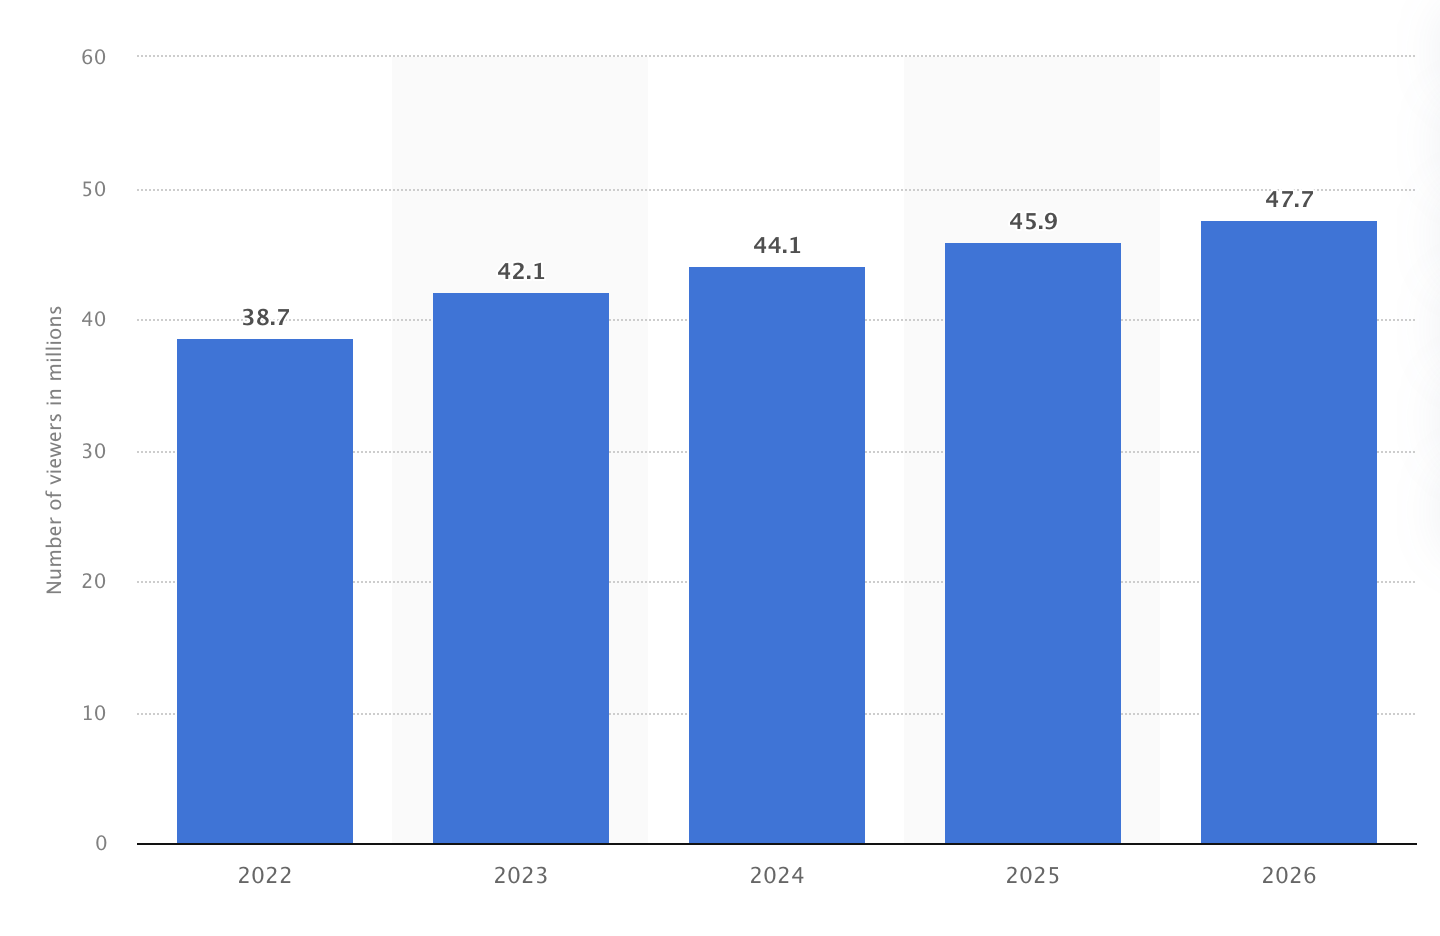
The number of Apple TV viewers has also increased over the years. In 2022, there were 38.7 million viewers, and in 2014, the number shot up to 44.1 million.
By 2026, the number of viewers is expected to increase to a whopping 47.7 million.
Among all the major OTT platforms, Netflix has the biggest market share, at 22%, followed by Apple TV, at 9%.
According to data from 2022, 20% of Americans watched Apple TV+ at all in the month before the survey, and daily use stood at 5%.
Device usage trends
94.1% of users use smartphones to access the internet.
Netflix is the fourth most popular video content app both in terms of active users and total time spent.
According to a 2024 survey in the US, 79% of those between 18 and 34 use their smartphones to watch online video content weekly.
Only around 2 out of 10 said they use a tablet.
Sources: Data Reportal, Statista
Market share and competition
Apple’s services, such as Apple Music and Apple TV+, and its App Store and developer ecosystem are all part of the bigger Apple puzzle.
Apple Music, TV+, and entertainment stats
As of March 2024, there were a total of 271 movies and TV shows available on Apple TV. This accounts for an increase of almost 100 movies and shows since April 2023.
All 271 movies and shows are available in the USA, while other major markets, such as Brazil, Germany, Mexico, and the United Kingdom, have 212, 217, 194, and 203 pieces of content, respectively.
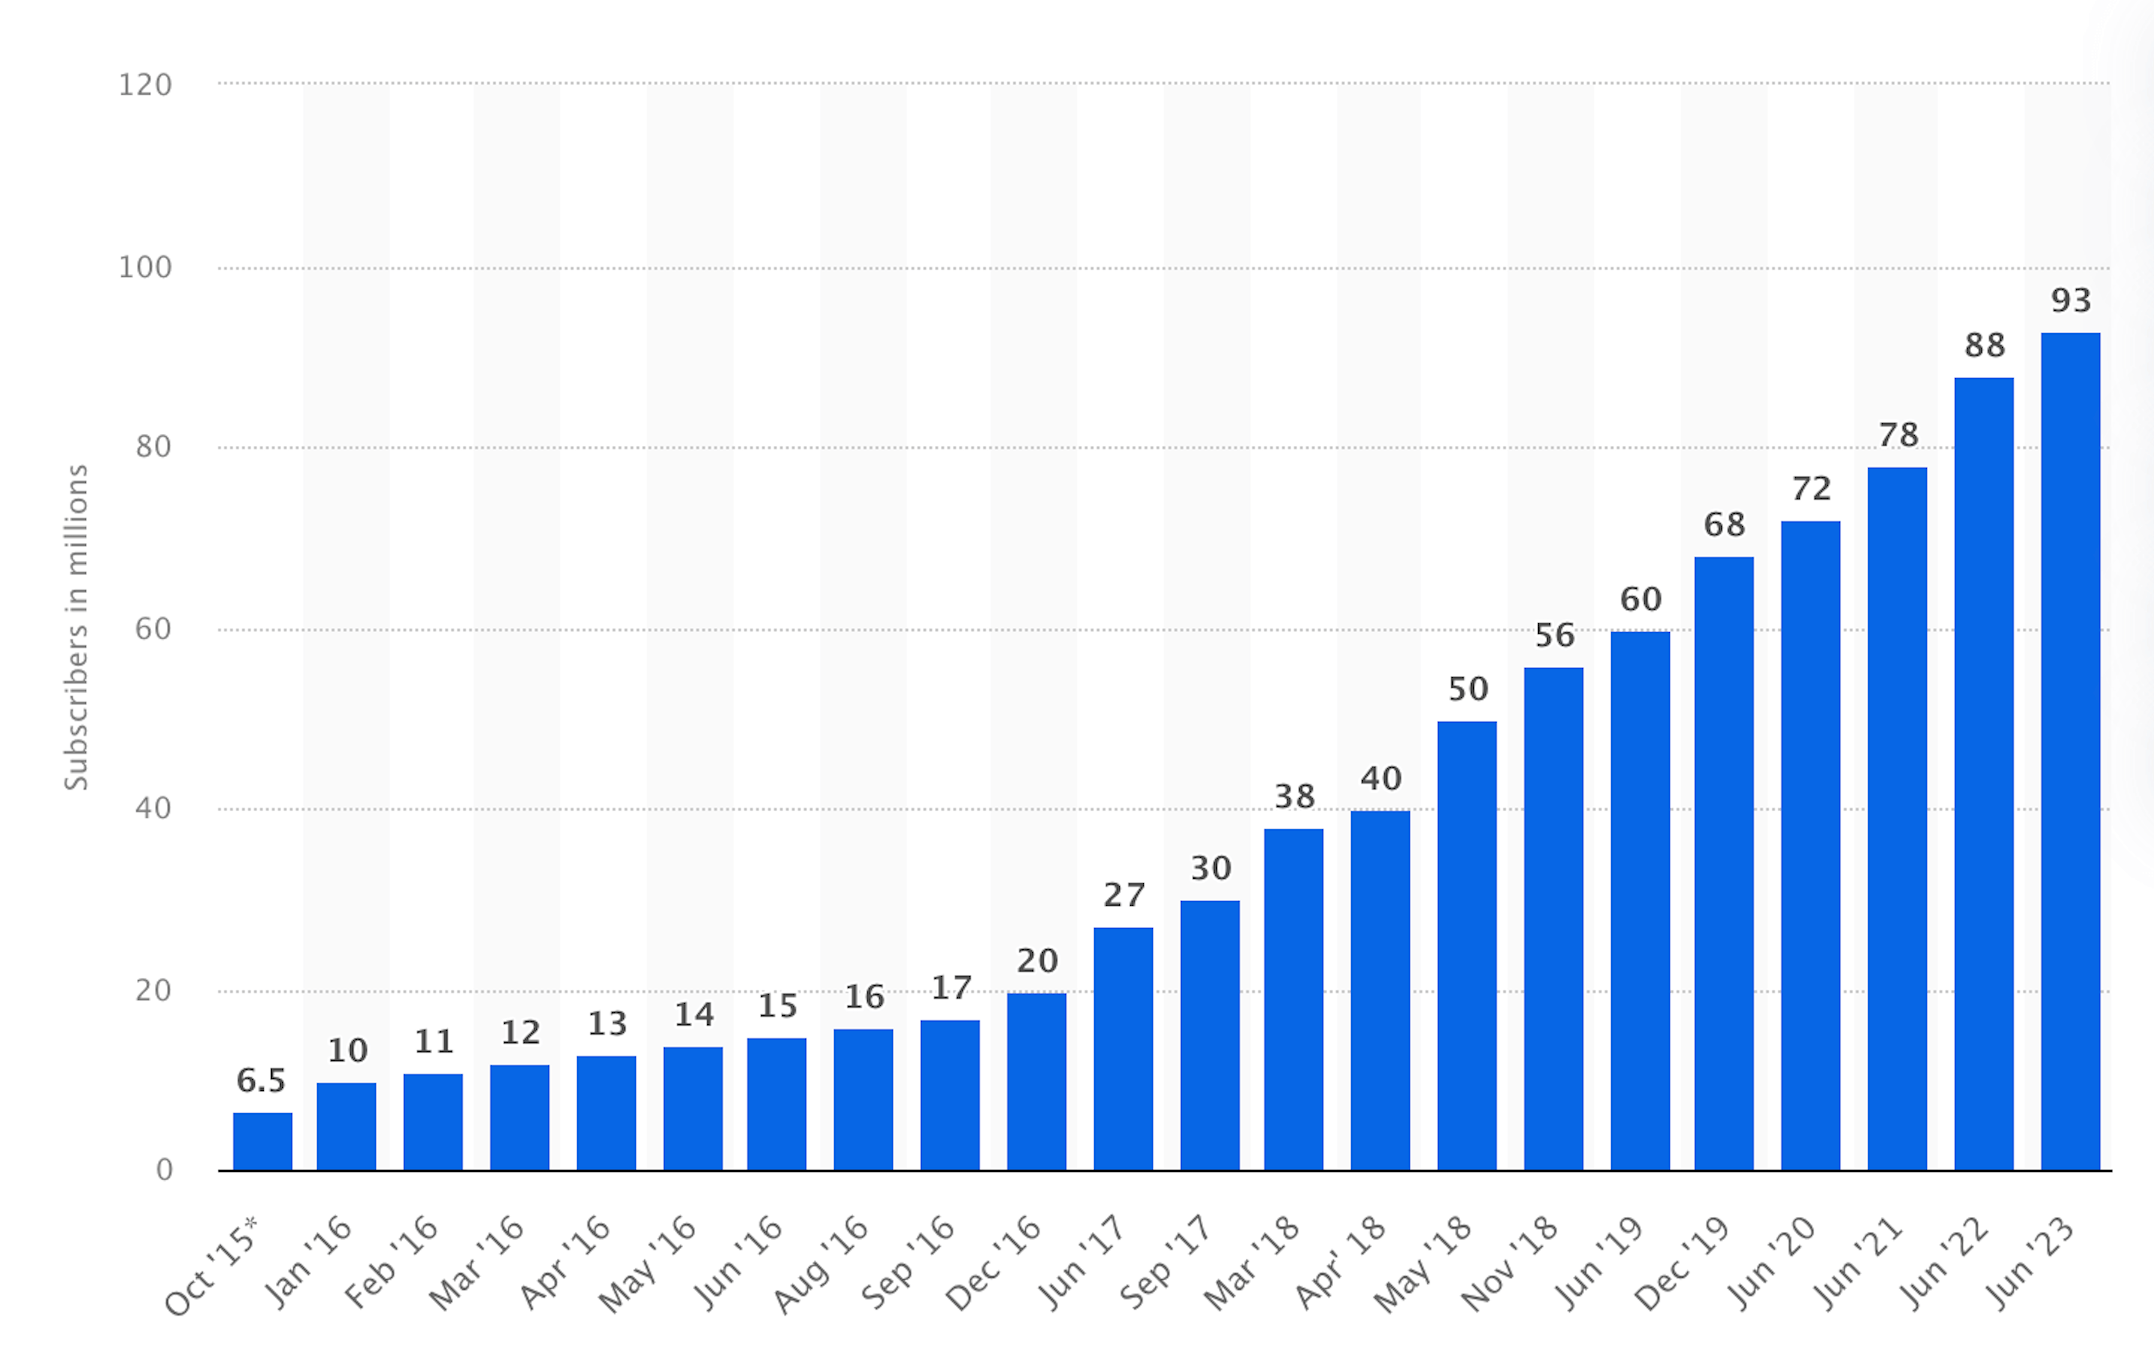
As of June 2023, Apple Music had 93 million subscribers worldwide, a dramatic increase from the 6.5 million subscribers it had when it was released in 2015.
App Store and developer ecosystem
As of the second quarter of 2024, the App Store had 1.54 million mobile apps available exclusively to iOS users.
Gaming apps accounted for 12% of all the apps in the store. In the second quarter of 2024, the App Store generated revenue of $25 billion from in-app purchases, subscriptions, and one-time purchases.
In the second half of 2024, the US was also the largest market for iOS, with customers spending $6.5 billion on the Apple App Store.
Sources: Statista
iCloud and data services
Apple’s cloud storage solutions are used by most Apple device owners, and their data services keep user privacy at the forefront. Here’s what you need to know:
iCloud, along with other services such as Apple Music, Apple TV, and others, contributed 22.3% of Apple’s total revenue in Q2 2024.
Apple offers storage options starting from 50GB to 200GB and even 2TB.
Apple has always prioritized data security and user privacy. With the latest updates to the ecosystem and features like on-device processing, your personal data can be used to optimize your device better without actually collecting any data.
Apple’s impact on technology and innovation
Over the years, Apple has also had a major impact on the world of technology and has been a key driver of innovation in AI, voice technology, and on-device processing technologies, among other areas.
Apple announced the availability of its latest suite of AI features under the Apple Intelligence umbrella on 28th October 2024.
It has revolutionized the use of AI on smartphones, offering features that allow you to summarize notifications and mail, refine writing, reduce distractions, and more.
Apple’s consistent innovations have set the standards for other smartphone manufacturers who are riding the AI wave to offer their users a well-rounded experience.
Sources: Apple
Environmental and sustainability initiatives
Apple has also been setting an example through its initiatives to reduce its environmental impact and inculcate more sustainable practices.
By 2030, Apple aims to reduce its carbon footprint to net zero emissions.
In fact, since 2015, they have reduced their carbon emissions by 55%.
Apple has avoided 18.5 tons of carbon emissions as a result of its Supplier Clean Energy Program in 2023.
22% of materials shipped in Apple’s products came from renewable and recycled materials in 2023.
Sources: Apple
Notta offers the most integrated AI meeting notes, summaries, and action items so nothing gets missed.
Apple user demographics and audience insights
What is the geographic makeup of Apple’s customers and their ages and income levels? I break down the key numbers in the two sections below.
Geographic distribution of users
The Americas accounted for the biggest share of the company’s revenue. As of Q4 2024, the Americas held 44% of the revenue, with Europe coming in second at 26%.
Apple’s revenues are the highest in the first quarter of every year. This is because of the holiday season.
Sources: Statista
Age, income, and lifestyle segmentation
As per Statista, 28% of iPhone owners are male, and 31% are female.
43% of iPhone users are between the ages of 18 and 34, compared to 39% of Android users. 57% of iPad users are below the age of 45, compared to 53% of Android tablet users.
The smallest segment of iPhone owners are between the ages of 45 and 54.
The average iPhone user earns $85,000 yearly, while the average Android user earns $61,000 yearly.
iPhone users tend to spend $101 each month on tech purchases, double the amount spent by Android users.
Sources: Statista, ComScore, ComScore, PR Newswire
The bottom line
As you can see, Apple has grown into possibly the biggest player in the world of technology with a global presence. I’ve listed over 60 Apple statistics that tell you everything you need to know about the company. AI transcriber app is among the best AI note-taking tools on the market today and works seamlessly across all Apple devices to transcribe your calls.
 Sources:
  Sources: